A sudden drop in Amazon sales feels like one problem, but it almost never is. Revenue on Amazon is the product of a few numbers you can already see in Seller Central: how many shoppers reached your detail page, how many of them bought, and at what price. When sales fall, at least one of those numbers moved, and each one points to a different set of causes. Losing the Featured Offer, running out of stock, a listing that quietly dropped out of search, an ad campaign that runs out of budget by early afternoon, a new competitor or a seasonal dip in demand all look identical on the sales graph. They look very different once you split the drop into its parts. This guide gives you a 7-check diagnosis in a fixed order, built only on reports Amazon documents itself. Every Amazon rule and number below is quoted from the Amazon.com (US) Seller Central help pages and the Amazon Ads Support Center as checked on 16 October 2026; other marketplaces can differ.
Amazon sales usually drop for one of 6 causes: a data or date-range artifact, losing the Featured Offer (Buy Box), being out of stock or stranded, a suppressed listing, ads running out of budget, or lower demand and new competitors. Split the drop in Business Reports into sessions, Unit Session Percentage and average selling price first, then check each cause in that order.
The one equation behind every sales drop
Before you open any tool, write the drop down as an equation. Amazon's own Business Reports glossary for the US store (Amazon.com) defines Unit Session Percentage as the number of units divided by the number of sessions for the selected period, expressed as a percentage, and defines Ordered Product Sales as the item price multiplied by the units ordered. Put together, that gives you the identity every diagnosis rests on: units ordered equal sessions multiplied by Unit Session Percentage, and Ordered Product Sales equal units ordered multiplied by the average selling price. If your sales fell 30%, one or more of those three factors fell, and the size of each change tells you where to look.
Factor
Where Amazon shows it
What a drop usually means
Sessions (traffic)
Business Reports > Detail Page Sales and Traffic by Child Item
Fewer shoppers reach the page: search rank, ads, suppression, demand
Unit Session Percentage (conversion)
Same report, next to Sessions
Shoppers arrive but do not buy: Featured Offer, price, stock, reviews, listing
Average Selling Price
Business Reports > Sales and Traffic (Ordered Product Sales / Units Ordered)
You sell the same units for less: price cuts, coupons, repricer floor
Featured Offer percentage
Same child item report
Your offer is not in the Add to Cart box for part of the page views
Two details in Amazon's definitions matter. First, a session is all activity by one shopper within a 24-hour period, so compare sessions to sessions and page views to page views, never one against the other. Second, Amazon notes that the Detail Page Sales and Traffic report sums page views only for days with sales activity on the ASIN, while the Detail Page Sales and Traffic by Child Item report sums page views across the whole date range regardless of sales. If an ASIN had several days with zero sales, the first report understates its traffic. For a sales drop, always use the by Child Item view.
Check 1: Is the drop real, and is it the size you think?
A surprising share of sales drops are measurement problems. On Amazon.com (US), Business Reports are available only on the Professional selling plan, and Amazon's US help page says the data is generally available for up to two years, so you have enough history to compare like with like. Start by fixing the comparison window. Compare the same number of days, the same weekdays and, where you can, the same period last year. Compare units ordered before you compare revenue, because revenue moves with price and units do not.
Next, check whether the drop sits in one ASIN or across the catalog. Pull the by Child Item report for both periods, download both as CSV (Amazon offers a Download button on Business Reports) and sort by the change in units. If one or two child ASINs explain most of the decline, you are diagnosing a product problem. If every ASIN fell by a similar percentage on the same day, look first at account-level causes: an account health warning, a shipping settings change, a holiday or event that ended, or a data delay. If you sell to Amazon Business customers, Amazon also shows the same metrics with a B2B suffix, so check whether the drop sits only there.
Do not diagnose on a 2-day window
Daily sales on one ASIN are noisy. Use at least 14 days on each side for a mid-volume ASIN, and 28 days when it sells fewer than 5 units a day, before you change anything.
Check 2: Split the drop into traffic, conversion and price
Once you know the drop is real and which ASINs carry it, split it. Take sessions, Unit Session Percentage and average selling price for both periods, then calculate how many units you would have lost from the traffic change alone (the change in sessions multiplied by the old conversion rate) and from the conversion change alone (the new sessions multiplied by the change in conversion rate). The two parts add up exactly to the change in units. A spreadsheet does it in minutes and tells you which of the next 5 checks to run first.
Mostly traffic: go to Checks 5, 6 and 7. Shoppers are not reaching the page.
Mostly conversion: go to Checks 3 and 4 first. Shoppers arrive but cannot or will not buy from you.
Mostly price: look at your own pricing: a repricer at its minimum, a running coupon or deal, or a business price below your regular price.
Traffic and conversion fell on the same date: suspect the Featured Offer first, because losing it can cut conversion and ad traffic at once.
Check 3: Did you lose the Featured Offer (Buy Box)?
The Featured Offer is the offer that appears with the Add to Cart and Buy Now buttons on the detail page. Amazon's US Business Reports glossary defines the Featured Offer percentage as the percentage of page views where the Featured Offer appeared for customers to add your product to their cart, and says it falls below 100% when the Featured Offer would result in the customer purchasing from another seller, or when your product was not available for purchase through it. On the Amazon.com (US) Becoming the Featured Offer help page, Amazon adds that the percentage is calculated as the page views in which your offer is featured divided by the total page views for your products, and that the Featured Offer is decided separately for each variation. You can hold it on the blue variation and lose it on the red one.
Read the Featured Offer percentage per child ASIN for both periods; a fall from the mid 90s into the 70s is a strong signal. Then look at why. Amazon lists the factors it considers: total price (item price plus shipping), the delivery promise (faster and more specific promises are favoured), free shipping, free returns, and seller performance, including order volume, chargeback rate and complaints from the Voice of the Customer dashboard. Amazon also lists what it does not consider: customer reviews and star ratings of the seller, and, if all other factors are equal, the Prime badge and the fulfillment method. Your offer cannot become featured while you are out of stock.
The fastest place to see a price-driven loss is Pricing Health in Seller Central. Amazon's US help page describes it as an overview of offers deactivated because of potential pricing errors, offers that are currently ineligible to become the Featured Offer because they are not priced competitively with retailers outside Amazon or are priced significantly higher than recent prices on Amazon or elsewhere, and offers that are eligible and priced within 5% of the Featured Offer price. If your ASIN shows up as ineligible, the fix is a price decision, not a listing fix. Our guide to how the Featured Offer is chosen in 2026 goes deeper on each factor, and how min and max prices really work covers the repricer side.
Amazon dropped the seller eligibility requirement in 2026
On the Amazon.com (US) Becoming the Featured Offer help page, Amazon states that as of September 2026 it no longer maintains a seller eligibility requirement, and offers from all sellers are now eligible to be evaluated for the Featured Offer. The Amazon.co.uk help page gives 20 July 2026 for the same change in the UK. If a reseller with a weaker track record suddenly started winning the box on your listing in the second half of 2026, this change is one possible reason.
Do not forget the other reason the Featured Offer percentage falls: another seller joined your listing. If you are a brand owner and the new offer is unauthorized, it is a separate problem with its own playbook, covered in Amazon hijackers: how to detect and remove them.
Check 4: Were you out of stock, or was your inventory stranded?
Stock problems cause a conversion drop that looks like a demand problem: sessions keep coming for a while, but nobody can buy from you. Look at inventory for each day of the bad period, not just today. A product out of stock for 6 of 28 days shows a lower average conversion rate even after it is restocked.
The less obvious case is stranded inventory. Amazon defines it as FBA inventory in fulfillment centers that does not have an associated active offer and is not available for sale; the listing may be suppressed or was never created, for example. On the Amazon.com (US) Resolve stranded inventory issues page Amazon adds two practical points. A listing can show as Active in Manage inventory while it shows as Stranded on Fix stranded inventory, and Amazon says Fix stranded inventory has the more accurate information. And by default, automatic relist only kicks in after a listing has been stranded for 7 days with the reason Listing closed or Item discontinued; you can shorten this to as little as 2 days in Edit automatic-action settings. After you fix the cause yourself, Amazon asks you to allow 48 hours for the update. With default settings, units you think are on sale can sit unsold for a week or more.
If stock was the cause, the fix is upstream: a better reorder point and lead-time buffer. Our guide to Amazon inventory forecasting walks through the math.
Check 5: Is the listing suppressed, or about to be?
A traffic drop with stable conversion often means fewer shoppers can find the listing at all. Amazon hides (suppresses) non-media listings from search and browse when they do not meet its standards for complete product information, such as a main image, a category (item type) and a title within the length limits. Amazon's help page is direct about the effect: a customer will not be able to find a suppressed listing in search. Child listings in some categories are also suppressed when key attributes are missing, for example a size or color value for shoes, or a unit count for consumables.
Two Seller Central views tell you where you stand. In Inventory > Manage All Inventory, the Activate listings section shows suppressed listings with next steps. Amazon also offers a quick filter called At-risk of search suppression for listings where Amazon requires you to add information before a certain date, and a Search suppressed filter for listings already removed from search. For both, Amazon's US help page says changes take up to 48 hours to reflect. A listing that crossed its deadline mid-month explains a sudden, step-like fall in sessions while conversion barely moves.
Check 6: Did your ads stop delivering?
If Sponsored Products bring a meaningful share of your sessions, three ad causes are worth checking, in this order.
No Featured Offer, no ads. Amazon Ads states that Sponsored Products and Sponsored Display campaigns generate 0 impressions when the advertised ASIN or SKU does not hold the Featured Offer, even when the campaign shows Delivering status. Sponsored Brands are not affected as long as the product is available to buy. If Check 3 showed a Featured Offer loss, your ad traffic fell with it.
Out of budget by midday. The Amazon Ads Support Center explains that budgets are spent as quickly as possible and are not paced, and that when a campaign reaches its daily budget it pauses until the next day. By default Amazon can raise the daily budget by up to 100% on high-traffic days, while keeping the month within daily budget times days. A campaign that used to last until evening and now runs dry at 2 pm loses every afternoon and evening shopper.
A paused, archived or changed campaign. A bid cut, a removed keyword or a rule that paused a campaign changes traffic on the day it happens. Compare the change history of your top campaigns with the date the drop started.
The quickest evidence for the budget cause is the Sponsored Products budget report. The Amazon Ads Support Center lists estimated missed impressions, estimated missed clicks, estimated missed sales and Average Time in Budget, with a 2-year lookback, and recommends looking for high-performing campaigns with less than 100% Average Time in Budget and estimated missed sales. If ad spend rose and sales fell at the same time, read ACoS vs TACoS before raising budgets, because the problem may be efficiency and not reach.
Check 7: Did demand fall, or did a competitor take it?
Only after Checks 1 to 6 come back clean should you accept "the market slowed down" as the answer. If you are a brand representative in Brand Registry, the Search Query Performance dashboard in Brand Analytics is the best primary data for it. Amazon's US help page says it shows, for the top search terms associated with your branded products, the query volume, impressions, clicks, add-to-cart and buys, with up to 1,000 queries in the brand view. If total query volume for your main terms fell by the same percentage as your sessions, the demand explanation holds. If query volume held steady but your impressions or clicks fell, someone else is taking that demand.
For competitors, look at new listings on page one, the closest competitor's price and coupons, and rating changes for your main search terms. The Query Detail view in Search Query Performance also compares your ASIN against the top 10 ASINs for a selected query, which shows who gained the clicks and purchases you lost.
Worked example: a 36% unit drop, diagnosed in order (illustrative)
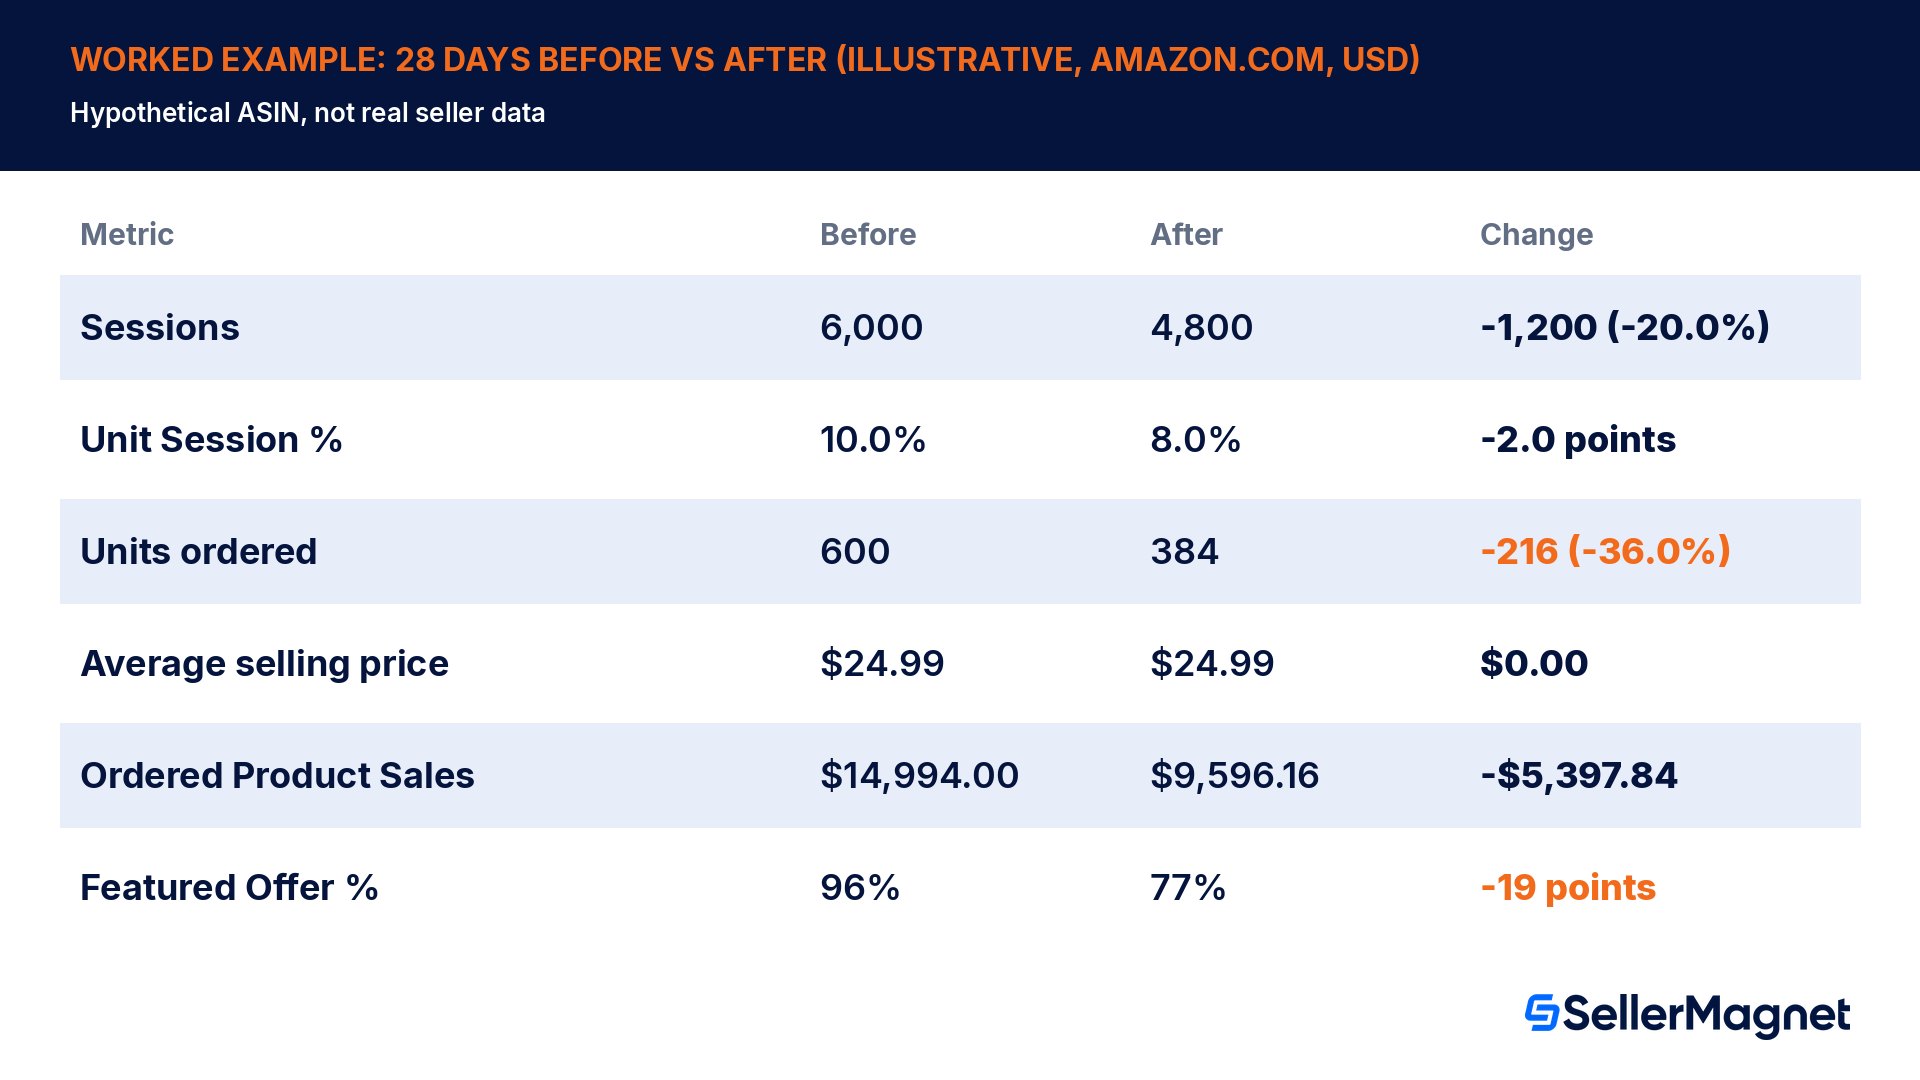
The numbers below are a hypothetical example for an ASIN on Amazon.com (US), not real seller data. Every figure is recomputed in the chart scripts. In the 28 days before the drop, the ASIN had 6,000 sessions and a Unit Session Percentage of 10.0%, so it sold 600 units. At an average selling price of $24.99, that is $14,994.00 in Ordered Product Sales. In the 28 days after the drop started, it had 4,800 sessions and a Unit Session Percentage of 8.0%, so it sold 384 units, or $9,596.16 at the same price. Units fell by 216, which is 36.0%, and sales fell by $5,397.84.
Metric (28 days, US)
Before
After
Change
Sessions
6,000
4,800
-1,200 (-20.0%)
Unit Session Percentage
10.0%
8.0%
-2.0 points
Units ordered
600
384
-216 (-36.0%)
Average selling price
$24.99
$24.99
$0.00
Ordered Product Sales
$14,994.00
$9,596.16
-$5,397.84
Featured Offer percentage
96%
77%
-19 points
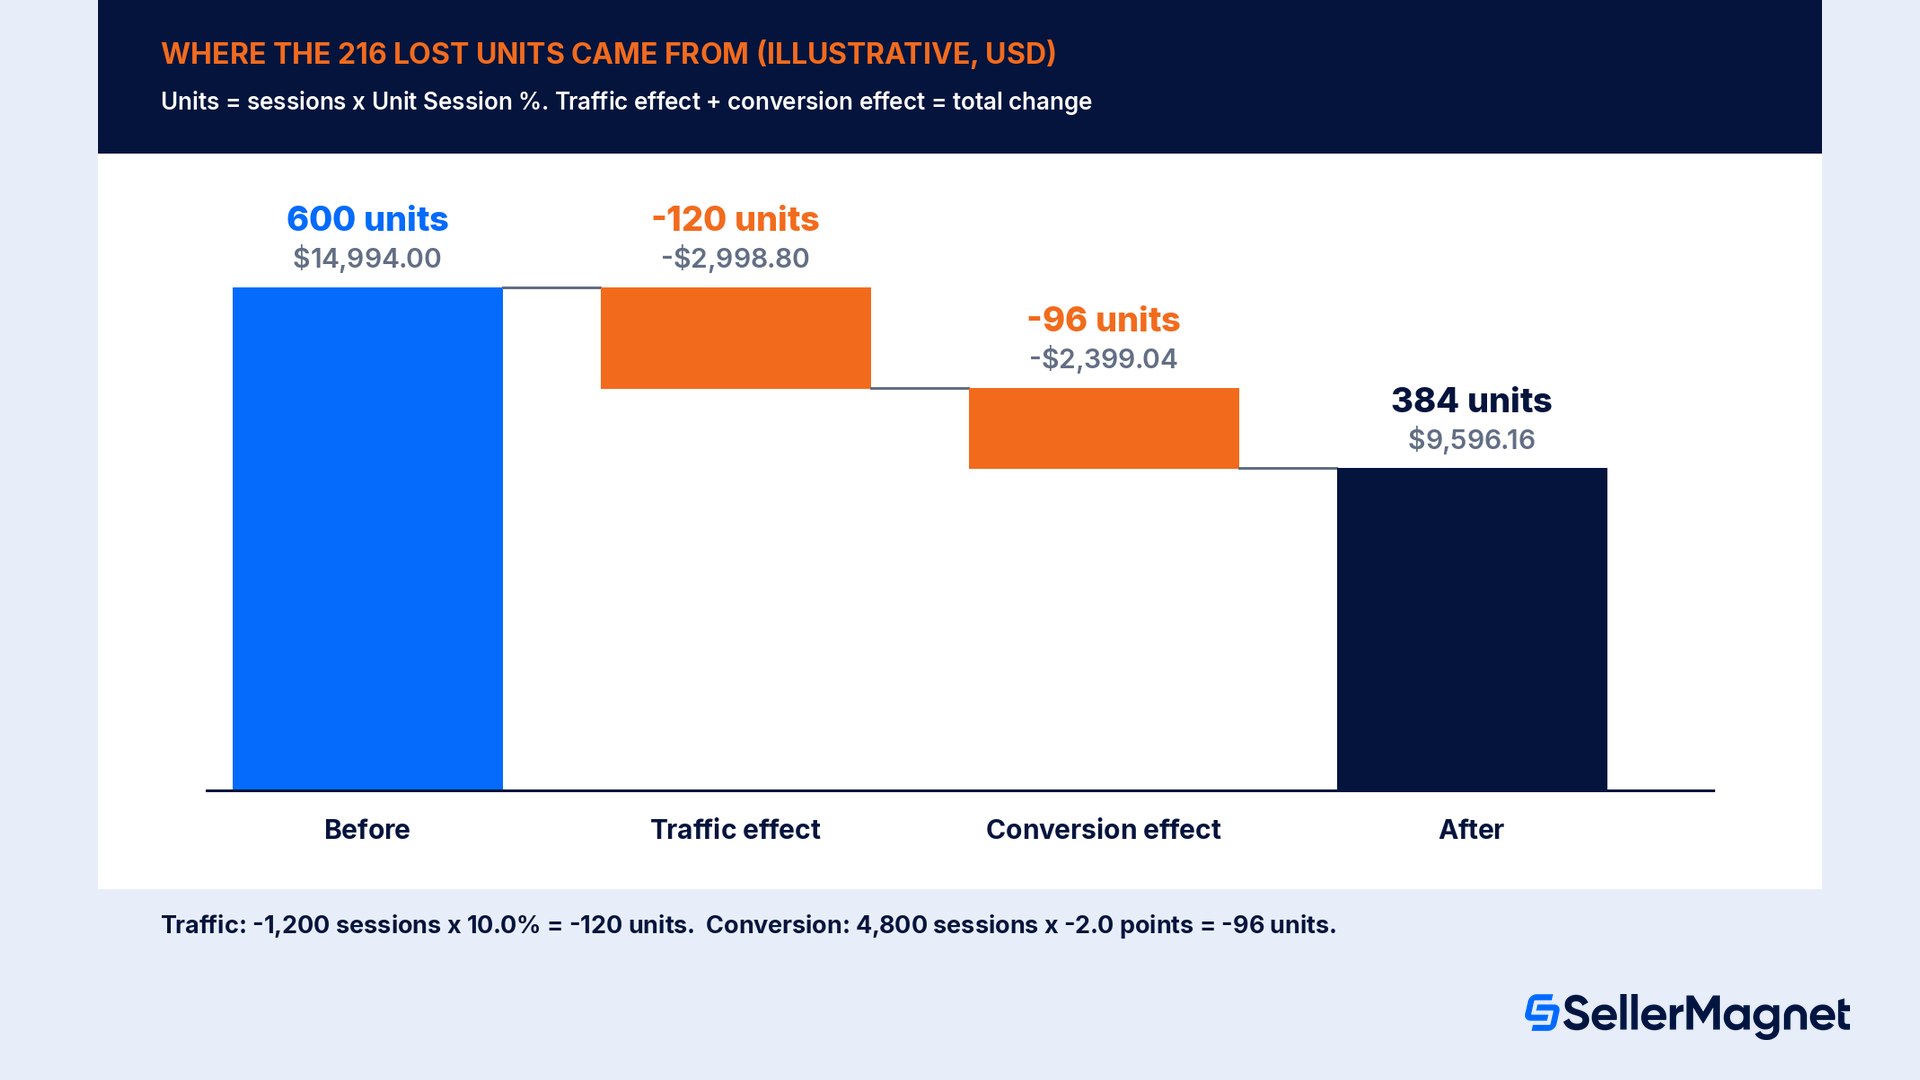
Check 1 passes: same 28-day window, same weekdays, one ASIN carries the drop. Check 2 splits the 216 lost units. The traffic effect is the lost 1,200 sessions at the old 10.0% conversion rate, which is 120 units or $2,998.80. The conversion effect is the 4,800 remaining sessions times the 2.0 point drop in conversion, which is 96 units or $2,399.04. Together that is 216 units and $5,397.84, so the split is complete and price did not move.
Both parts fell on the same date, so Check 3 comes first, and the Featured Offer percentage fell from 96% to 77%. That one number explains the conversion effect almost exactly: 77 divided by 96 is 0.80, and 8.0% divided by 10.0% is also 0.80. In other words, shoppers who saw this seller's offer in the box bought at the same rate as before; there were simply fewer of them. Pricing Health showed the reason: a second seller had joined at a lower total price, and the seller's repricer was stuck at a minimum price set months earlier.
Check 6 then explains the traffic effect. Sponsored Products campaigns for this ASIN served no impressions during the hours the other seller held the box, which matches the Amazon Ads rule from Check 6. Checks 4, 5 and 7 came back clean: no stockout, no suppression flag, and steady query volume for the main search terms. The fix was a pricing decision (review the minimum price against current fees and costs), not a listing rewrite or a bigger ad budget.
Symptom to cause: a quick lookup table
What you see in Business Reports
Most likely causes
Check first
Sessions down, Unit Session Percentage flat
Search suppression, lower search rank, ads out of budget, lower demand
Checks 5, 6, 7
Sessions flat, Unit Session Percentage down
Featured Offer loss, stockout days, a competitor's price or coupon, new negative reviews
Checks 3, 4, 7
Both down from the same date
Featured Offer loss (cuts conversion and Sponsored Products traffic)
Check 3, then 6
Units flat, sales down
Your own price: repricer floor, coupon, deal, business price
Average selling price
Every ASIN down by the same % on the same day
Account-level change, shipping settings, event ending, data window
Check 1
Sales at zero, inventory shows units
Stranded inventory or a closed listing
Check 4
Common mistakes when sales drop
Rewriting the listing before splitting the drop. A new title and new images change conversion, but if the drop came from traffic or the Featured Offer, you just added a second variable and lost the clean comparison.
Reading the wrong report. The Detail Page Sales and Traffic report sums page views only on days with sales, so it hides traffic on zero-sales days. Use the by Child Item report for any drop diagnosis.
Treating the Featured Offer as an account setting. Amazon decides it per offer and per variation, and it can rotate between close offers. Read the percentage per child ASIN, not once for the whole catalog.
Trusting Manage inventory over Fix stranded inventory. Amazon says a listing can look Active in one and Stranded in the other, and that Fix stranded inventory is the accurate one.
Raising ad budgets on a product without the Featured Offer. Sponsored Products will not serve for it anyway, so the extra budget buys nothing until the box is back.
Blaming seasonality without data. If query volume for your main terms held steady, demand did not fall; your share of it did.
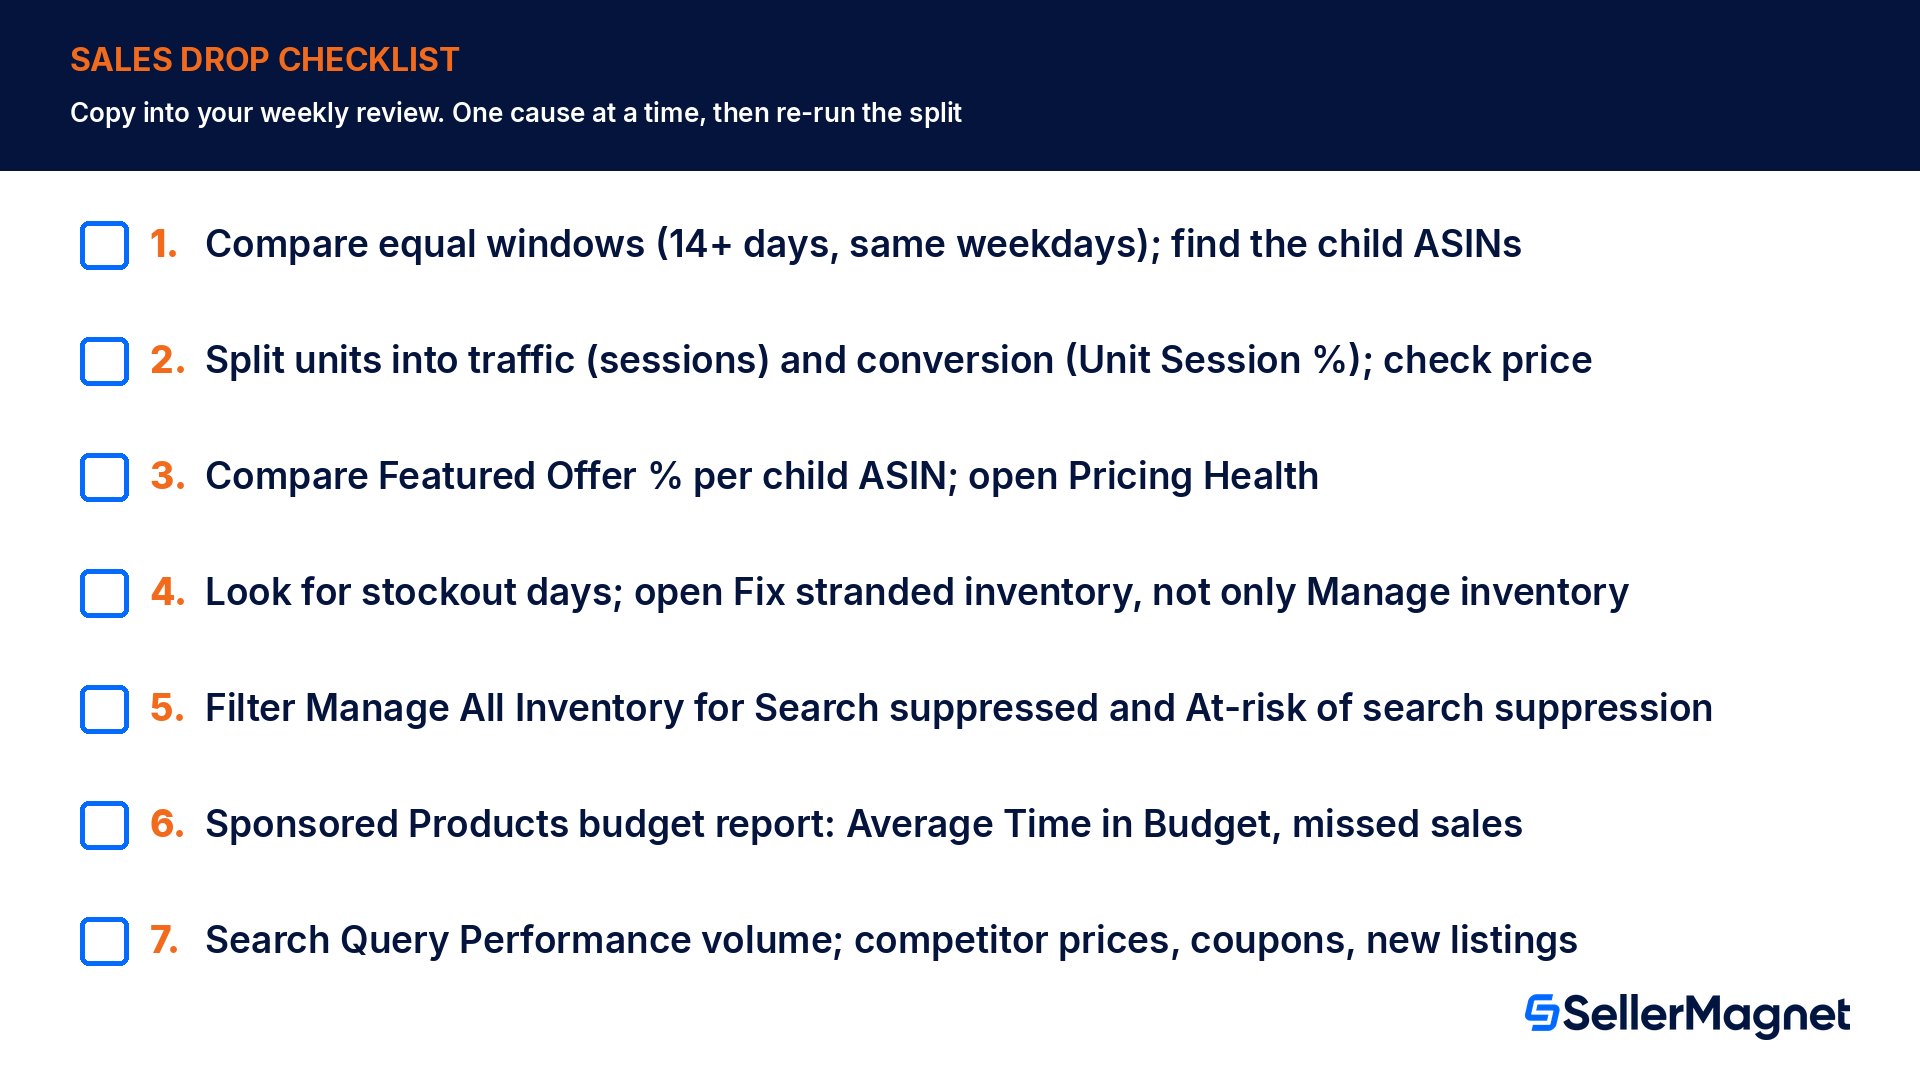
The 7-check sales drop checklist
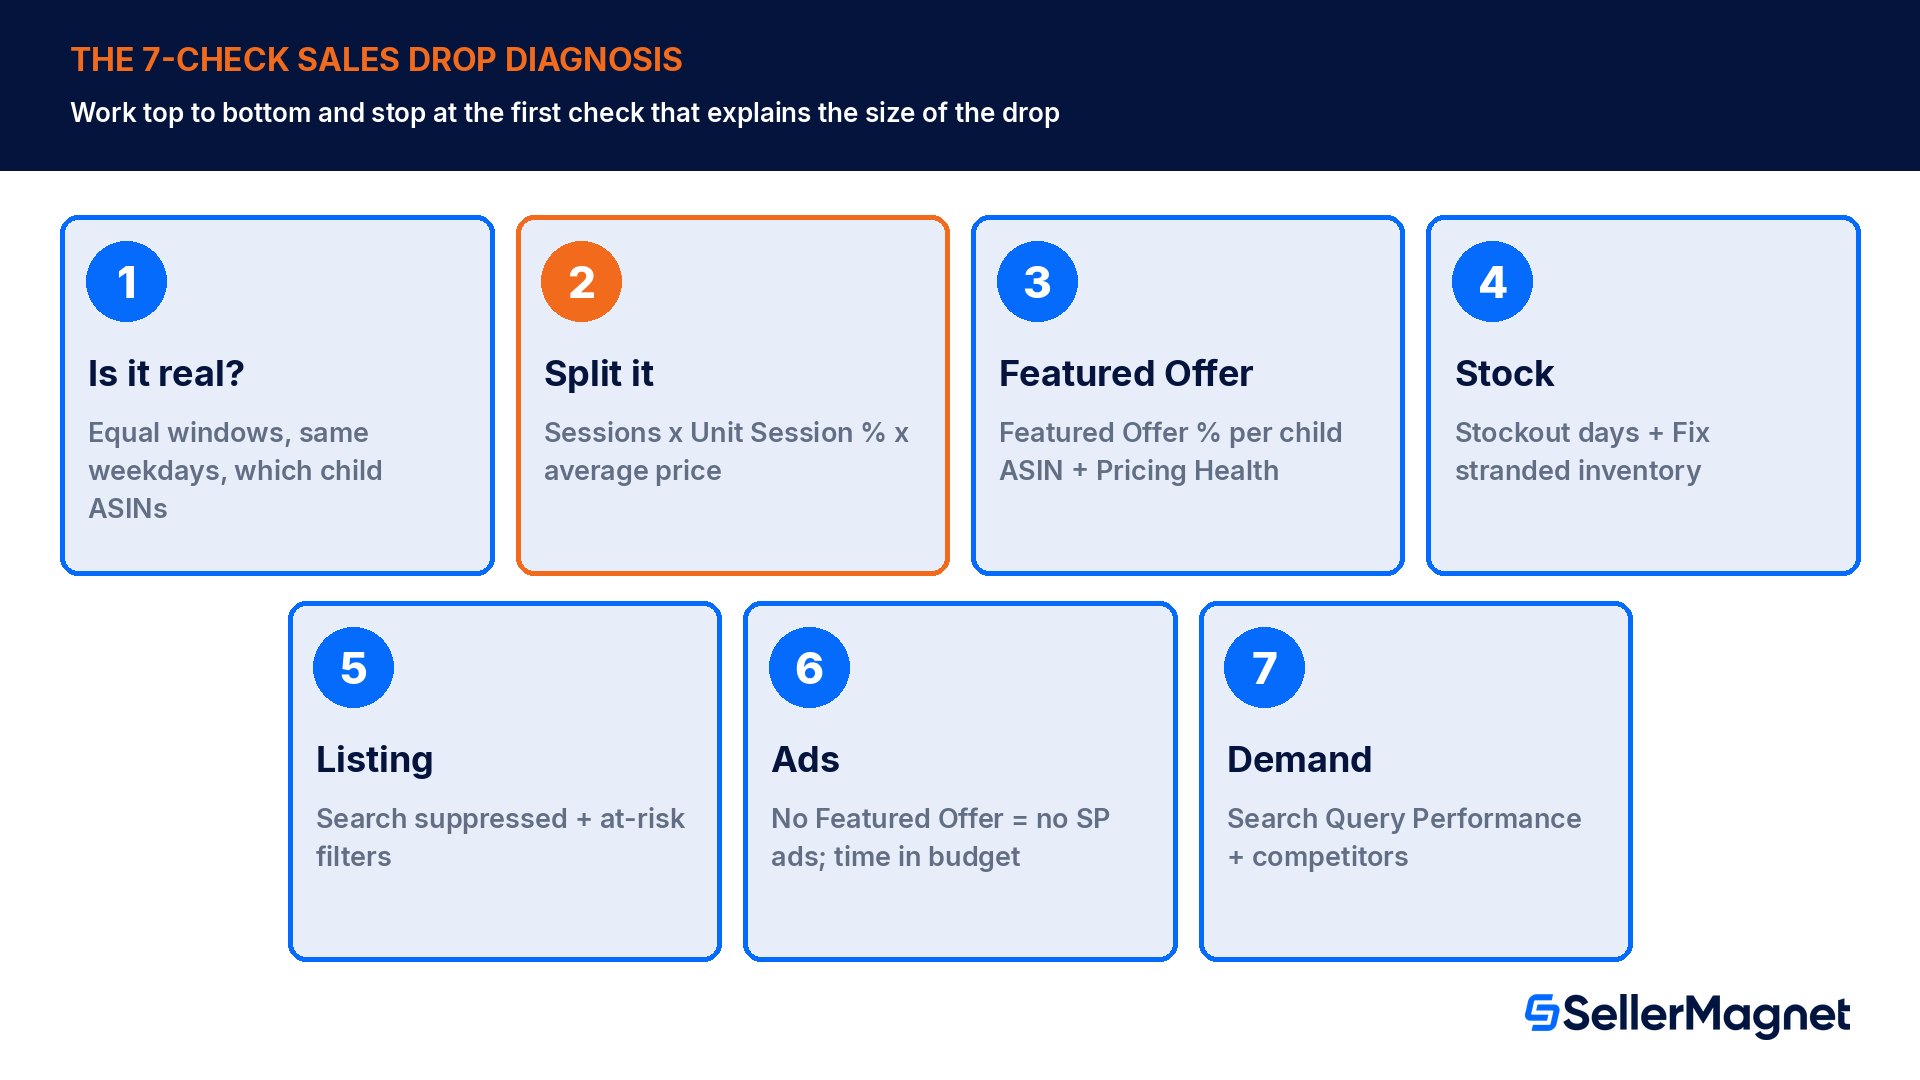
Print this or copy it into your weekly review. Work top to bottom and stop at the first check that explains the size of the drop. Then fix that one cause, wait for the data (at least 14 days for a mid-volume ASIN), and re-run the split before you move on.
How to diagnose an Amazon sales drop in 7 checks
Confirm the drop - Compare equal windows (same weekdays, at least 14 days) in Business Reports and find which child ASINs carry the decline.
Split it - Separate the change in units into a traffic effect (sessions) and a conversion effect (Unit Session Percentage), and check average selling price.
Check the Featured Offer - Compare Featured Offer percentage per child ASIN and open Pricing Health for ineligible or not-competitive offers.
Check stock and stranded inventory - Look for stockout days in the window and open Fix stranded inventory, not only Manage inventory.
Check listing visibility - Use the Search suppressed and At-risk of search suppression filters in Manage All Inventory, and compare the live detail page with your records.
Check ads - Open the Sponsored Products budget report for Average Time in Budget and estimated missed sales, and review recent campaign changes.
Check demand and competitors - Use Search Query Performance (brand representatives) for query volume and share, and review competitor prices, coupons and new listings.
How SellerMagnet shortens the diagnosis
Most of the 7 checks are about noticing a change on the day it happens. SellerMagnet's Offer Watch checks your connected catalog for new sellers, Buy Box losses, undercuts and suppressed listings, once a day on the base plan, so Checks 3 and 5 arrive as an alert rather than a monthly surprise. Competitor Tracker follows any ASIN, including competitor products you do not sell, for Buy Box owner, price, rank, stock, listing edits, rating drops and negative reviews, which covers most of Check 7. The Product Sourcer shows BSR history, price history, competing offers and who has held the Buy Box for any ASIN, which helps you date when a change started. The Analytics Dashboard shows net profit per product after Amazon fees, COGS, shipping, VAT and refunds, so you can tell whether a price fix that wins the box back still leaves you a margin.
Why did my Amazon sales suddenly drop to zero?
A sudden fall to zero almost always means the offer cannot be bought: no sellable stock, a closed or stranded listing, a suppressed listing, or an account-level hold. Check Fix stranded inventory first, then the Search suppressed filter in Manage All Inventory. Amazon's US help pages say fixes to stranded or suppressed listings can take up to 48 hours.
How do I know if I lost the Buy Box on Amazon?
Open Business Reports, Detail Page Sales and Traffic by Child Item, and compare the Featured Offer percentage for both periods. Amazon defines it as the share of page views where your offer was in the Add to Cart box. A clear fall, for example from the mid 90s to the 70s, means another offer won part of your page views.
What is a good Unit Session Percentage on Amazon?
There is no single good number: conversion varies by category, price and traffic source, and Amazon's glossary defines the metric without a target value. Compare each ASIN with its own history over equal windows. As a rule of thumb, a sustained fall of more than a fifth from its normal level is a signal to run Checks 3 and 4.
Can losing the Featured Offer reduce my ad traffic?
Yes. Amazon Ads states that Sponsored Products and Sponsored Display generate 0 impressions when the advertised ASIN or SKU does not hold the Featured Offer, even if the campaign shows Delivering. Sponsored Brands are not affected as long as the product is available. A Featured Offer loss can therefore cut conversion and paid traffic together.
How long should I wait before deciding a sales drop is real?
Use at least 14 days on each side for a product selling 5 or more units a day, and 28 days for slower products, with the same weekdays in both windows. Shorter windows mostly measure normal daily noise. If the drop is to zero, do not wait: check stock, stranded inventory and suppression at once.
Does Amazon tell me when my listing is suppressed from search?
Seller Central shows it, but you have to look. In Inventory, Manage All Inventory, the At-risk of search suppression filter lists listings that need information before a deadline, and the Search suppressed filter lists listings already removed from search. Amazon's US help page says changes can take up to 48 hours to show after you fix them.
Should I lower my price when sales drop?
Only if the split points to price. If the Featured Offer percentage fell and Pricing Health lists the offer as not competitive or near the Featured Offer price, a price change is the right tool. If traffic fell instead, a lower price mostly reduces your margin. Check net profit after fees before you cut.
Stop Juggling Tools. SellerMagnet Combines Everything You Need.