Manual Product Research vs Data-Driven Sourcing (2026)
R
RenéFreelance Amazon Editor
|
14 min read
A single Best Seller Rank reading and a glance at the review count feel like enough to decide whether a product is worth sourcing. They almost never are. A rank snapshot is one point on a line that can move by tens of thousands of places in a week, a review count says nothing about margin, and neither one touches the number that actually decides whether the order makes money: the real landed-cost verdict after every Amazon fee. This guide walks through where manual product research and a data-driven sourcing workflow land on different answers for the exact same product, using a hypothetical worked example to show the size of the gap.
Manual Amazon product research usually means reading a product's current Best Seller Rank and review count and judging a landed-cost margin from a rough shipping guess. A data-driven sourcing workflow instead checks the BSR history over weeks or months (not just today), reads the sell-through rate to separate a real trend from a short spike, and calculates the landed-cost verdict from the actual fulfillment fee tier, not an estimate. The three blind spots a manual check usually misses are rank volatility, sell-through rate, and the true fee tier, and each one can flip a BUY decision into a PASS once it is checked properly.
Why aren't a rank and a review count a verdict?
Best Seller Rank and review count are the two numbers every sourcing method starts from, because they are the two numbers visible on the page without any extra tool. The problem is not that they are wrong; it is that both are a snapshot of a single moment, and a sourcing decision commits money for weeks or months. A rank of 1,180 looks like strong, steady demand on the day it is read. Whether it has been there for 60 days or for 6 hours changes the decision completely, and a one-time check cannot tell the two apart.
Review count carries the same limitation from a different angle: it accumulates over the product's whole lifetime, so it says nothing about whether demand today looks like demand six months ago. A listing with 400 reviews and a rank of 1,180 can be a genuinely consistent seller, or it can be a product that sold steadily for years and has been fading for the last three months while the reviews from its best period keep the count high. Manual research, done by opening the listing and reading what is there, has no way to separate those two cases without pulling a rank history.
Blind spot 1: is a rank snapshot the same as a 90-day range?
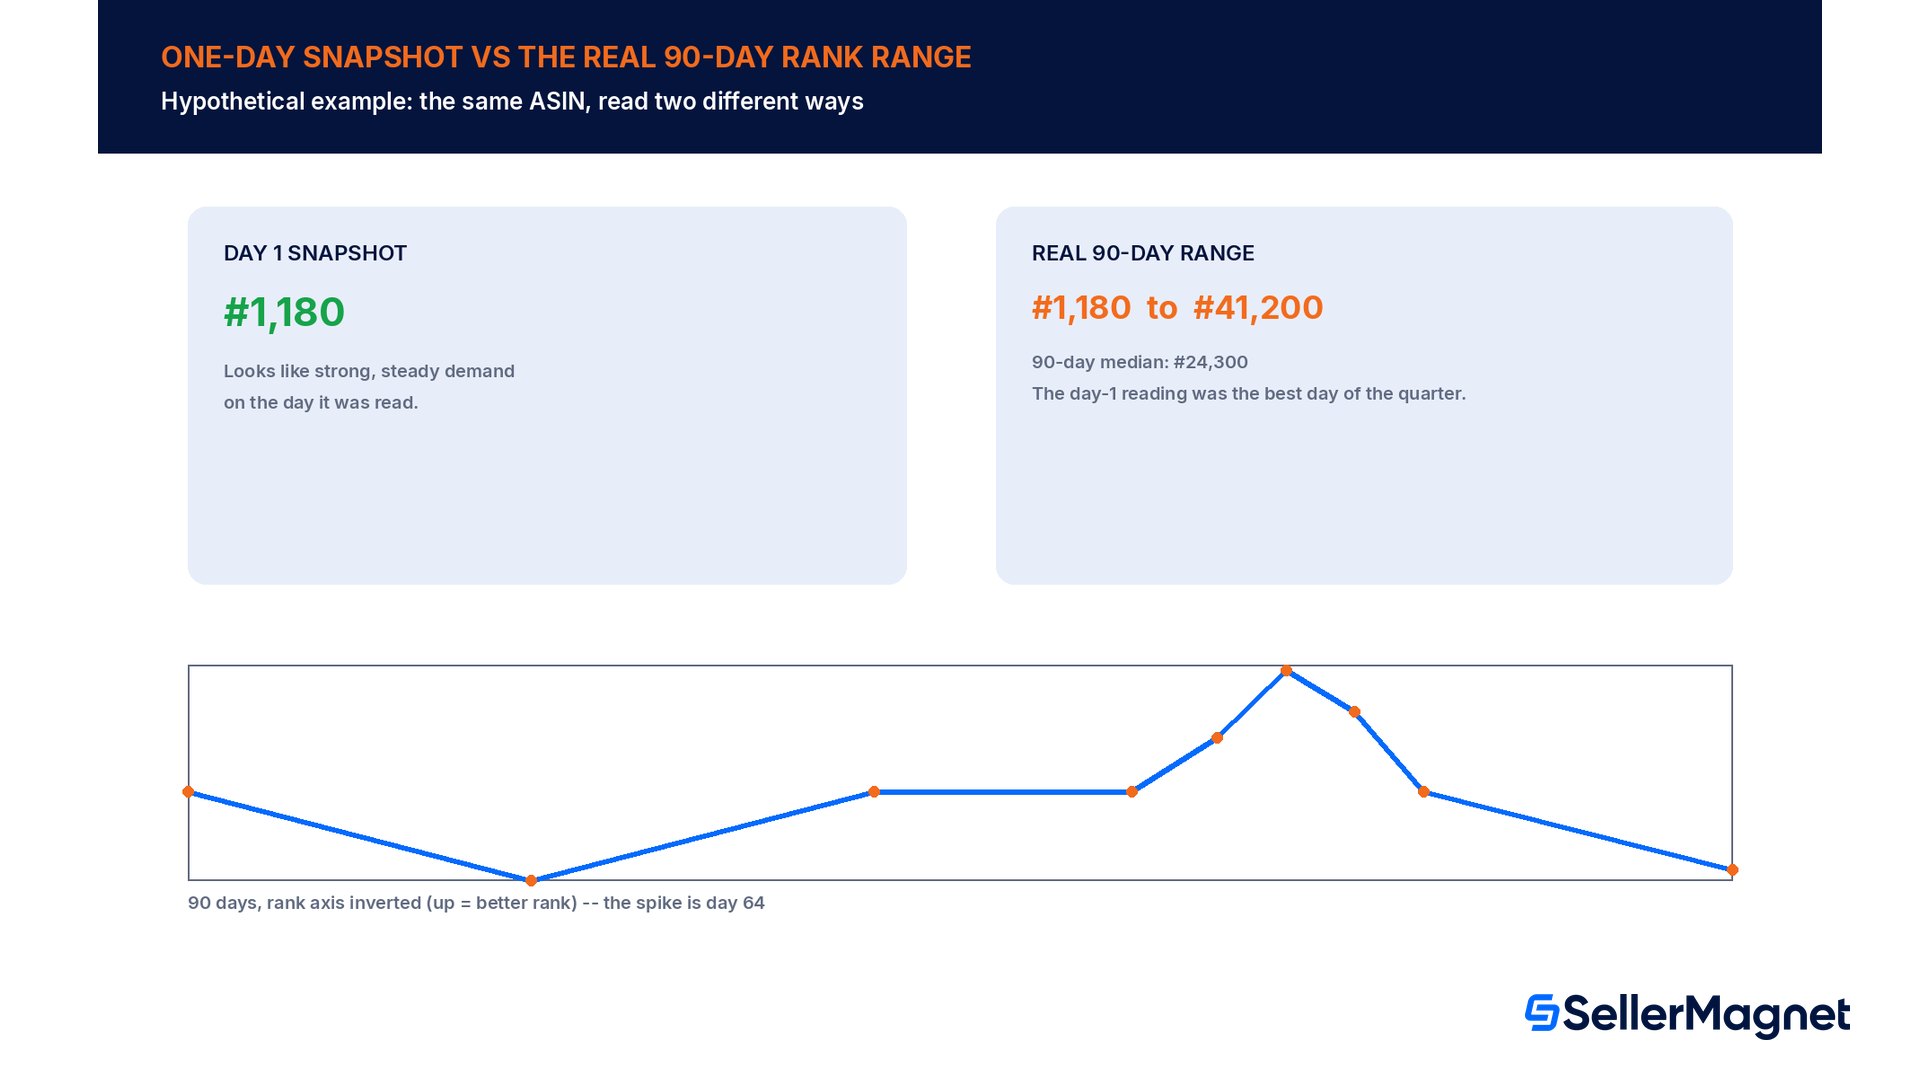
In the hypothetical example below, the same ASIN's Best Seller Rank is read on day 1 at 1,180, which would pass almost any manual gut check. Pulling the same ASIN's 90-day history instead shows a range from a low of 1,180 to a high of 41,200, with a 90-day median of 24,300. The day-1 snapshot happens to land on the single best reading of the whole quarter, not a typical one.
A snapshot cannot tell you which day you landed on
Without a history behind it, there is no way to know from a single rank reading whether it represents a typical day, a slow day or the best day of the quarter. The number itself does not change; only the context that explains it does.
Blind spot 2: is a sell-through spike the same as a trend?
Rank history alone still leaves one question open: is the high point a real trend taking hold, or a short spike from a promotion, a seasonal event or a competitor going out of stock for a week? Sell-through rate, the share of available stock that actually sells in a given window, answers that question directly. In the hypothetical example, the baseline sell-through rate sits at 18%. For a 9-day window it jumps to 61%, then drops to 9% once the window closes.
That shape, a short sharp jump followed by a drop below baseline, is the signature of a spike, not a new steady demand level: the spike very likely pulled forward sales that would otherwise have happened over the following weeks, which is exactly why the rate falls below baseline afterward rather than settling back at it. A manual check that stops at the rank reading during the spike window has no way to see this pattern; it only sees the good number.
Blind spot 3: what landed-cost verdict does a manual guess skip?
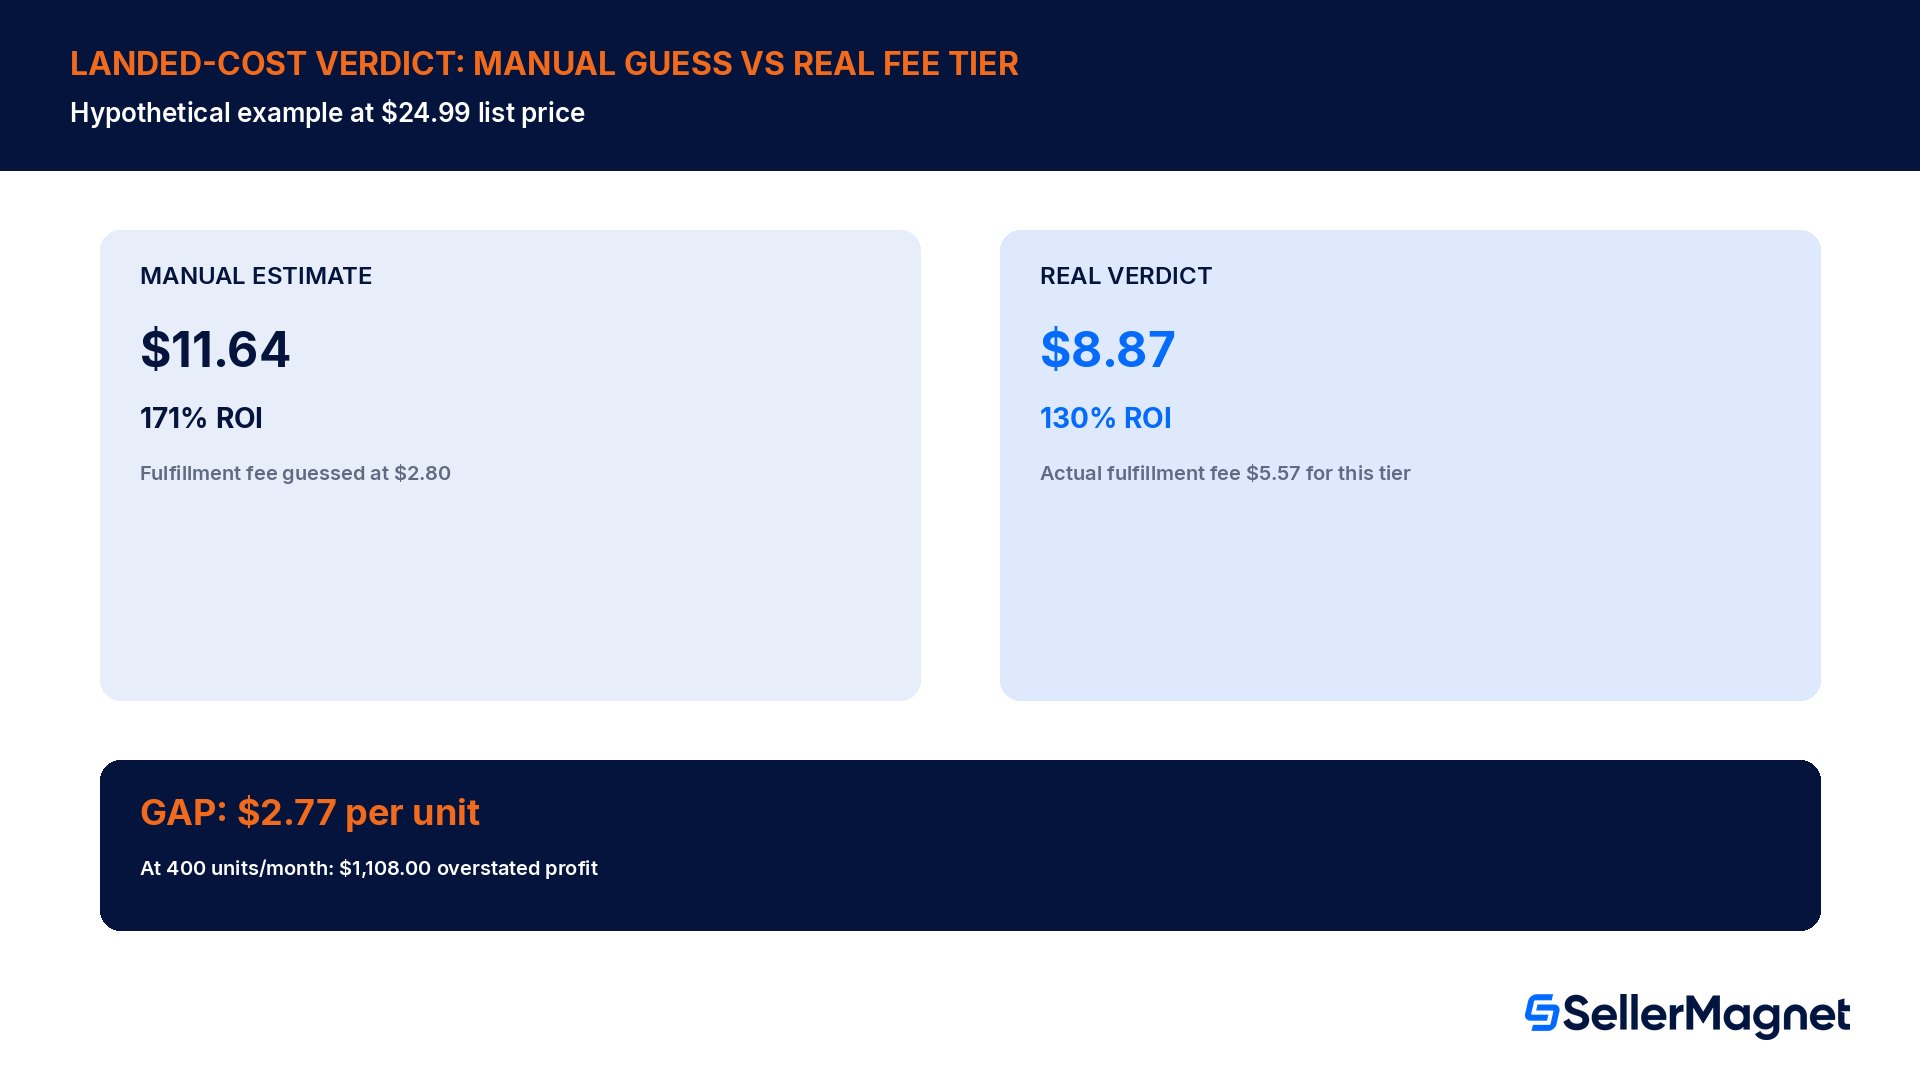
Even a product with genuinely stable demand can still fail on margin, and this is the blind spot that costs real money fastest. A manual check usually estimates the per-unit cost with a flat shipping guess instead of reading the actual fulfillment fee tier for that product's exact size and weight. In the hypothetical worked example below, a seller is comparing a product listed at $24.99 with a landed unit cost (manufacturing plus freight to the fulfillment center) of $6.80. The category referral fee is 15%, or $3.75 (see the current rate for this product's own category on our referral fees by category guide).
Manual estimate
Real landed-cost verdict
Fulfillment fee used
$2.80 (rough shipping guess)
$5.57 (actual fee for this size/weight tier)
Referral fee
$3.75
$3.75
Landed unit cost
$6.80
$6.80
Margin per unit
$11.64
$8.87
ROI on landed cost
171%
130%
The gap between the two columns is $2.77 per unit, which does not look dramatic on a single sale. At 400 units a month, the same gap is $1,108.00, money that the manual estimate said was profit and the real fee tier says was never there. Both numbers describe the identical product at the identical price; only the fee used to calculate margin changed.
Putting the three checks together: the MOQ decision
The three blind spots compound when they feed into a single real decision: how many units to order. In the hypothetical example, a supplier's minimum order quantity for this product is 1000 units. A sourcing decision made from the day-1 rank snapshot during the sell-through spike would reasonably assume demand close to the spike-week rate and expect to sell through the order quickly. The 90-day median tells a different story: a realistic monthly demand of about 95 units, which means the same 1000-unit order actually takes roughly 10.5 months to sell through at a normal pace, not the few weeks the spike-week reading would suggest.
Ten and a half months of inventory sitting in a fulfillment center carries its own cost beyond the capital tied up in it: storage fees accrue every month that stock sits unsold, and a slow-moving ASIN is exactly the kind of listing that risks a low-inventory or aged-inventory fee down the line if the actual sell-through keeps lagging the forecast used to justify the order. None of that risk is visible from the rank snapshot that started the decision; it only shows up once the sell-through rate and the real demand median are checked.
Why the gap is bigger for wholesale and online arbitrage than for private label
A private label seller usually controls the product spec, so the landed unit cost and the fulfillment fee tier are known well before the first unit ships; the main risk is demand, not fee math. Wholesale and online arbitrage sourcing flip that balance. The product already exists with a fixed size, weight and packaging decided by someone else, which means the fulfillment fee tier is whatever that packaging happens to land in, not a number a seller can plan around in advance. A supplier's case pack can also force an order quantity well above what a single rank reading would suggest buying, which is exactly where the MOQ math in the worked example above does the most damage: the same sourcing mistake that costs one seller a few weeks of extra inventory can cost another nearly a year of it, for the identical margin gap.
The same logic applies across marketplaces for a seller sourcing the same ASIN into more than one Amazon store. A product's rank, sell-through pattern and even its fee tier can differ by marketplace, so a landed-cost verdict and a rank history pulled for one store do not automatically transfer to another; each marketplace effectively needs its own version of the same three checks before a cross-border sourcing decision is made.
How seasonality changes which check matters most
Seasonal categories make the sell-through check more important, not less, because a seasonal spike and a real demand shift look almost identical on a short rank history. A product that only sells well for 6 to 8 weeks a year will show the exact same short, sharp rank improvement whether the category is genuinely growing or just hitting its one predictable window. The way to tell them apart is to compare the current spike against the same calendar period in a prior year's history where it exists, rather than against the last 90 days alone; a seasonal product's 90-day median calculated right after its peak will understate normal demand for the rest of the year just as badly as the peak reading overstates it. For a genuinely new or newly trending product with no prior-year data to compare against, the safer read is the post-spike sell-through rate once the window closes, since that number reflects what demand looks like once the pulled-forward sales have already happened.
Common mistakes sellers make researching a product by hand
Treating today's BSR as a typical day. A single reading cannot distinguish a steady performer from a product having its best week of the quarter; only a multi-week history can.
Reading sell-through rate during a spike window as the new normal. A short jump followed by a drop below baseline is usually pulled-forward demand, not a lasting trend.
Estimating the fulfillment fee with a flat shipping guess. The actual fee depends on the exact size and weight tier; a rough guess can be off by several dollars a unit on a landed-cost verdict that decides whether the product is even worth sourcing.
Sizing a minimum order quantity off the best rank reading instead of the 90-day median. The gap between the two can turn a few weeks of expected sell-through into nearly a year of it.
Checking a product once and moving on. Rank, sell-through and fee tiers all change; a product that passed a check two months ago is not guaranteed to still pass it today, especially once a reorder decision is on the table again.
Checklist: before committing to a sourcing decision
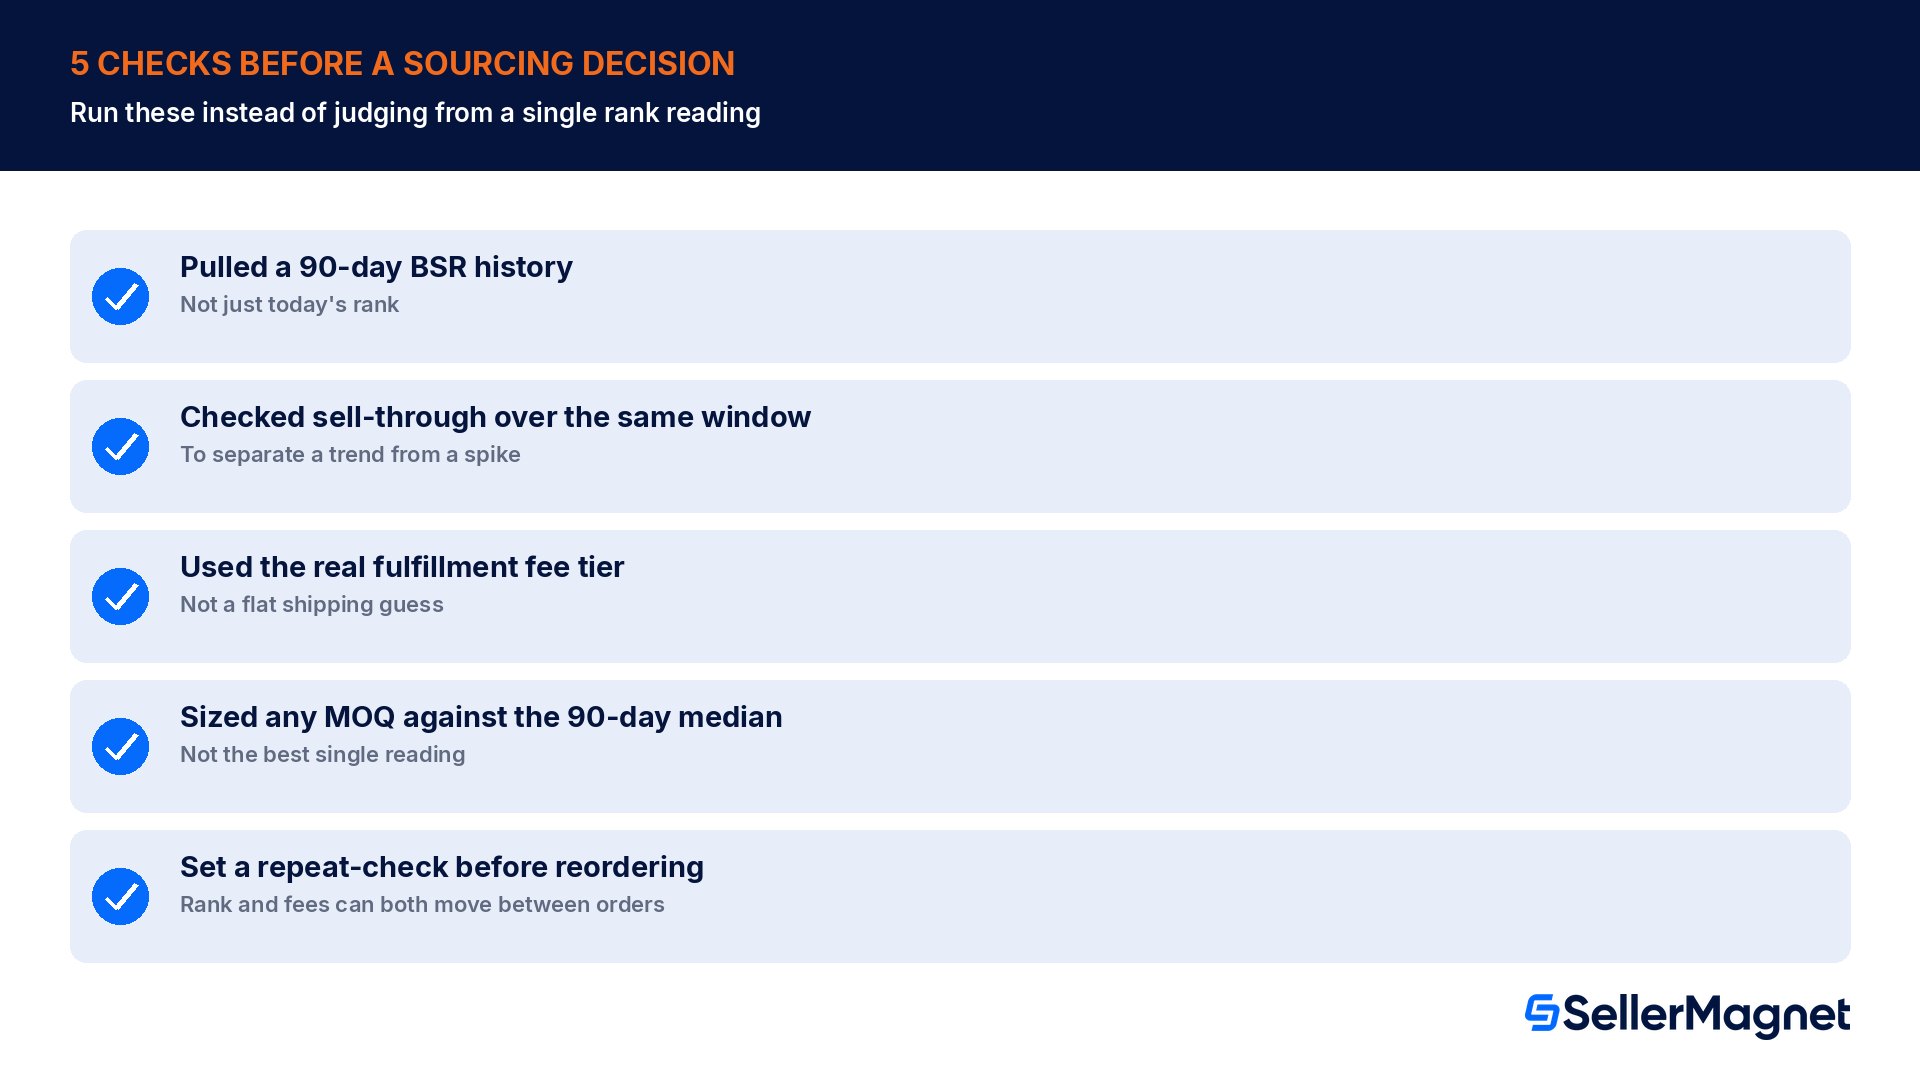
Pulled at least a 90-day BSR history, not only today's rank.
Checked the sell-through rate over the same window to separate a real trend from a spike.
Calculated the landed-cost verdict from the actual fulfillment fee tier for this product's exact size and weight, not a flat shipping guess.
Sized any minimum order quantity against the 90-day median demand, not the best single reading.
Repeated the same check before a reorder, since rank, sell-through and fee tiers can all move between orders.
How to run the same three checks yourself
Check a sourcing candidate the data-driven way before ordering
Pull the rank history, not just today's number - Look at the last 90 days of Best Seller Rank for the ASIN, not only the current reading, before judging whether demand looks steady.
Read the sell-through rate over the same window - Check whether any high-demand period lasted more than a week or two and whether it was followed by a rate below the baseline, the signature of a spike rather than a trend.
Calculate the landed-cost verdict from the real fee tier - Use the product's actual size and weight to find its fulfillment fee, then subtract the referral fee and landed unit cost from the sale price for the true margin, not a rough shipping guess.
Size the order against the median, not the peak - Check a supplier's minimum order quantity against the 90-day median monthly demand so the order's expected sell-through time reflects a normal month, not the best one on record.
Set a repeat-check before every reorder - Run the same three checks again before committing to another order, since rank, sell-through and fee tiers can all have moved since the first check.
Where SellerMagnet fits next to doing this by hand
The Product Sourcer looks up any ASIN, UPC, EAN or ISBN and returns fees, profit, ROI, BSR history, price history, competing offers and Buy Box holder history in one lookup, so the 90-day rank picture and the real fee-based margin are both visible for the same product at the same time instead of being checked in separate places. The free Chrome extension shows a BUY, MARGINAL or PASS verdict directly on Amazon's own product and search pages, built from the seller's own criteria, with no sign-up card required (see the extension overview).
For a whole supplier list instead of one ASIN at a time, Bulk Sourcer runs the same BUY / MARGINAL / PASS verdict, ROI, margin and profit-at-cost across every row in one background job, using the seller's own connected-account fees where available and flagging any row where a fee had to be estimated, which is the exact gap the landed-cost worked example above walks through by hand.
None of this replaces judgment about the product itself: whether it fits a brand, whether a supplier is trustworthy, whether the category carries restrictions. What a repeatable, data-driven check replaces is the risk of a sourcing decision resting on whichever single number happened to be visible on the day someone looked.
Is a Best Seller Rank snapshot ever enough to source a product?
It can be a reasonable first filter to decide whether a product is worth a closer look, but it should not be the final check. A single reading cannot tell a steady performer from a product having an unusually good day, which is exactly what a rank history over several weeks is for.
What is sell-through rate and why does it matter more than rank alone?
Sell-through rate is the share of available stock that actually sells in a given window. Rank can move from demand or from a competitor going out of stock; sell-through rate shows whether units are genuinely moving, and whether a high-demand period lasted long enough to be a trend rather than a short spike.
Why would a landed-cost estimate and the real margin differ so much on the same product?
The gap usually comes from the fulfillment fee. A flat shipping guess ignores the exact size and weight tier a product actually falls into, while the real fee is set by that tier. In the worked example above, that difference alone accounts for a $2.77 per-unit gap between the manual estimate and the real verdict.
How much history should I check before trusting a rank reading?
At least 90 days gives enough range to see whether a product's rank is typically stable, seasonal or spiky, rather than judging it from whatever the rank shows today. Shorter windows can still hide a recent short-term spike that looks like steady demand, and longer windows help with clearly seasonal categories where a single quarter would miss the pattern.
Does a bad sell-through week always mean the product is a poor fit?
Not necessarily; a single slow week can be noise, especially right after a busy period, so one weak reading alone should not disqualify an otherwise solid product. The pattern worth watching for is a short spike followed by a sustained drop below the normal baseline, which usually means demand was pulled forward rather than genuinely growing week over week.
How does a minimum order quantity interact with sell-through rate?
An MOQ sized against a peak demand reading can leave a seller holding months of extra stock once demand returns to its normal median, tying up cash in slow-moving inventory and storage fees. Sizing the order against the 90-day median monthly demand instead, rather than the best week in that window, keeps the expected sell-through time realistic.
Do I need to repeat these checks before every reorder?
Yes. Rank, sell-through rate and fulfillment fee tiers can all change between orders, so a product that passed the check two months ago is not guaranteed to still pass it today, particularly once a size or weight change or a new fee rate applies.
Does a data-driven workflow replace judgment about the product itself?
No. Fit with a brand, supplier trustworthiness and category restrictions still need a seller's own judgment. A data-driven workflow removes the risk of a sourcing decision resting on a single snapshot number, it does not remove the need to evaluate the product and supplier on their own merits.