The search-term report you pull from your advertising console only tells you what happened on the keywords you bid on. It stays silent on the query where your product never showed up at all, and on the query where it showed up and a competitor still took the sale. Inside Seller Central's Brand Analytics, a report called the Search Query Performance dashboard answers a different question: for a given shopper search, how many people searched it across the whole marketplace, and what slice of that funnel, impressions, clicks, cart adds and purchases, actually went to your brand. This guide works through who can see the dashboard, what the Brand view and the ASIN view each show, how to read a query's four funnel shares with a worked example, what the Query Detail view's ASIN comparison does, how it differs from its sibling Search Catalog Performance dashboard, the four export types behind its Generate Download button, and where this report fits next to the search-term report you already use for PPC.
The Search Query Performance dashboard is a Brand Analytics report in Seller Central, available to sellers with a Brand Representative role in Brand Registry. For a chosen search query it shows the total number of impressions, clicks, cart adds and purchases across the whole marketplace, next to your own brand's or ASIN's count and share of each. It combines organic and Sponsored Products search-results traffic, excludes widget placements like Top Rated, and offers a Query Detail view that ranks the top 10 ASINs for that query by a combined Query ASIN score. A dash in any cell means the data is missing for that period, not zero, and the report's numbers are not meant to be compared against advertising or Business Reports metrics.
Who can actually open this dashboard
Amazon's own help page is specific about the gate: Brand Analytics is only available to sellers who have a Brand Representative role assigned to a brand in Brand Registry. You must be internal to the brand and responsible for selling the brand in the Amazon store. A seller account with no enrolled brand, or a brand that is enrolled but where nobody holds the Brand Representative role yet, sees nothing here. A permissions error on the page is fixed in Seller Central's global user permissions page under Amazon Brand Analytics, granted by the account's primary administrator, not a support ticket. The dashboard itself first shipped in 2022 as part of a pair, Search Catalog Performance alongside Search Query Performance, announced on the Seller Forums by Amazon's own News_Amazon account; it has since picked up an ASIN-level view, a downloadable export and the Query Detail ASIN comparison covered below, so a seller who checked it once years ago and moved on is working from an outdated picture of what it shows. The ASIN view itself was a later addition, also announced by News_Amazon, which let brand owners view search query performance data for specific ASINs within the brand catalog using the Search Query Performance dashboard... you can measure the search performance of a specific product by metric, such as clicks or conversion rate, within a selected time frame. Before that rollout the dashboard only had the Brand view, so a brand could see its catalog-wide query performance but not isolate one SKU inside it.
Brand Registry first
There is no path into Search Query Performance without Brand Registry. If a brand is not yet enrolled, that is the actual first step, not a dashboard setting.
What the dashboard actually measures
Per Amazon's own description, The Search Query Performance dashboard provides visibility into the performance of the top search terms associated with your branded products based on customer search behavior. The report surfaces query volume, impressions, clicks, add-to-cart, and buys. The scope of what counts as a search event is also stated directly: The search queries are selected based on their overall performance in search results, and includes organic and Sponsored Products originating from the search results page for all customers. It excludes traffic from widgets on the search page such as 'Top Rated' or 'New Arrivals.' Two things follow from that wording. First, this is a blended report: a sale that came from an unpaid search result and a sale that came from a Sponsored Products ad on the same search results page both count here, so the dashboard will always show more total demand for a query than a Sponsored Products search-term report alone. Second, an impression only counts when an ASIN is actually displayed on the search results page itself, An impression is counted every time the ASIN is displayed in the search results page, so a product that ranks for a term but gets pushed past the shopper's scroll depth, or a term surfaced only inside a widget, will not add to this number.
Brand view vs ASIN view: two ways to slice the same query
The dashboard renders the same underlying data two ways. In the Brand view, each row of the report shows the performance of a single query associated with your brand's catalog, aggregated for a selected time period. The total number of populated queries will vary based on your catalog size, with a maximum of 1,000 query results. That is a hard ceiling: a brand selling thousands of SKUs across dozens of categories still only sees its top 1,000 queries by volume, so a long-tail search term that only ever brings in a handful of shoppers a month may simply never appear. In the ASIN view, each row shows the performance of a single query associated with a single brand's product, aggregated for a selected time period, which is the view to use when the question is about one listing rather than the whole catalog, for example checking whether a specific product is actually capturing the queries its title and bullet points are meant to win.
View
What one row shows
Best question to answer with it
Brand view
One query, aggregated across the whole brand catalog (max 1,000 queries)
Which top search terms for my brand am I under-represented on.
ASIN view
One query, aggregated for a single product
Is this specific listing capturing the queries it should rank for.
Query Detail view
The top 10 ASINs for one chosen query, ranked by Query ASIN score, plus your ASIN
Who exactly is winning this query, and by how much, right now.
Reading the four funnel shares: a worked example
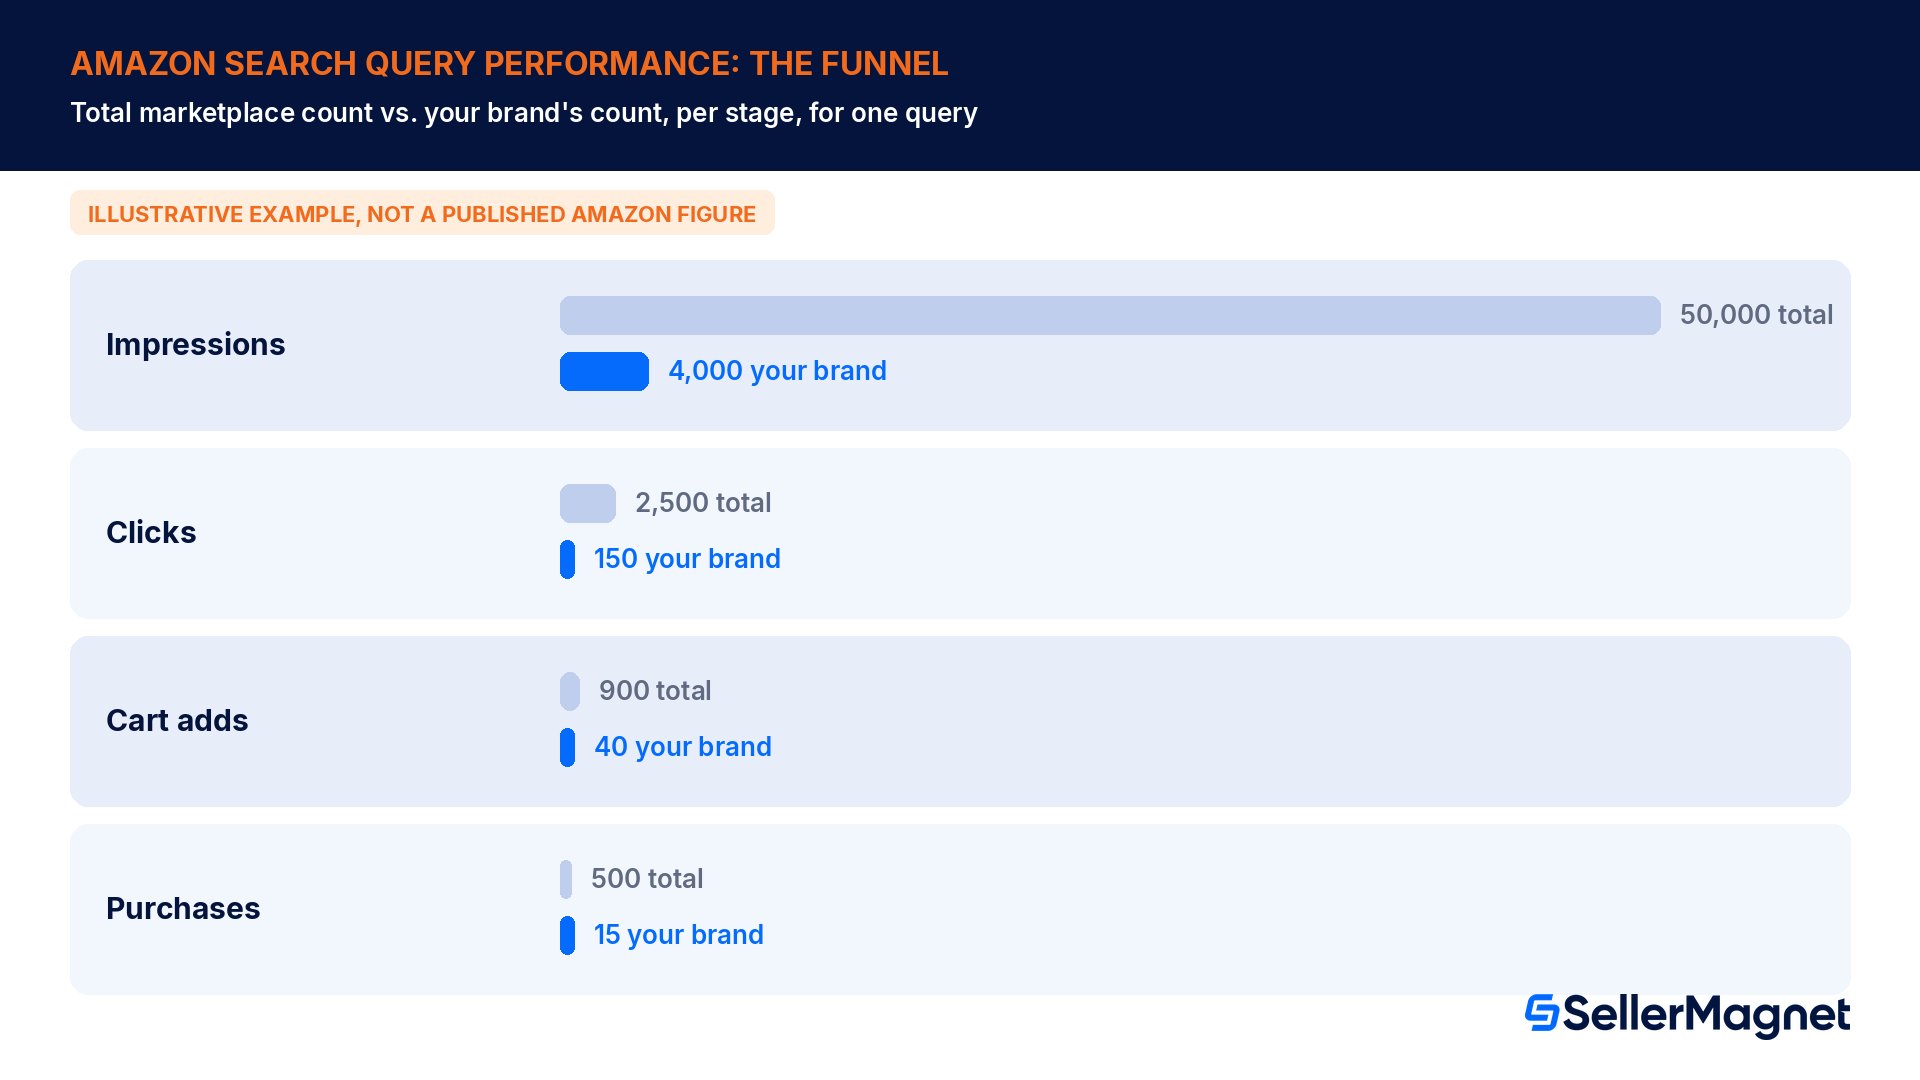
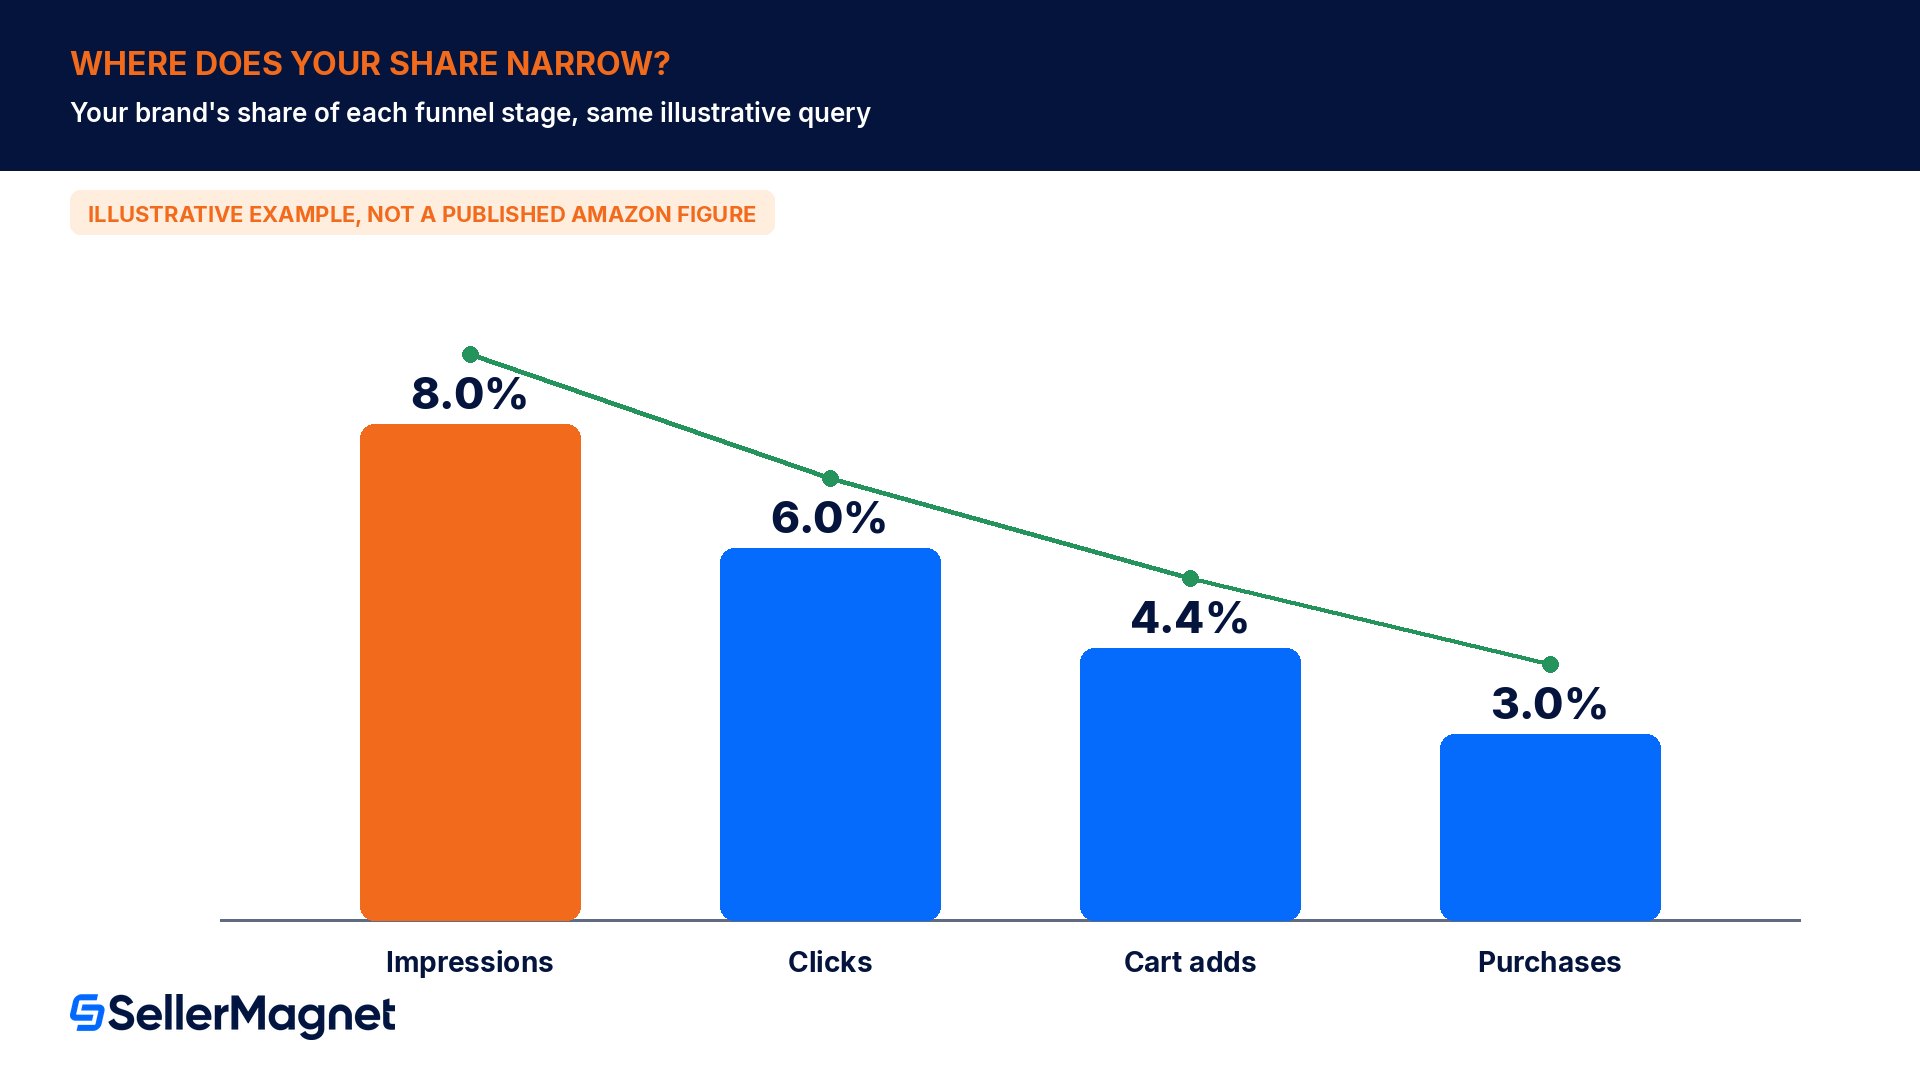
Amazon does not publish real per-query figures anywhere, so the numbers below are an illustrative, internally consistent example built only to show how the four stages behave relative to each other, not a quote from any real report. Picture the query stainless steel water bottle and a brand selling one bottle under that term. Across the whole marketplace, the query generated 50,000 impressions, 2,500 clicks, 900 cart adds and 500 purchases in the period. The brand's own ASIN, inside that same total, logged 4,000 impressions, 150 clicks, 40 cart adds and 15 purchases.
Funnel stage
Total marketplace
Your brand
Your share
Impressions
50,000
4,000
8.0%
Clicks
2,500
150
6.0%
Cart adds
900
40
4.4%
Purchases
500
15
3.0%
The number worth watching is not any single stage, it is how the share CHANGES from one stage to the next. In this example the brand captures 8.0% of impressions but only 3.0% of purchases for the exact same query, a share that shrinks at every step. A share that holds roughly flat from impressions through to purchases means the product converts shoppers at about the same rate as the rest of the field once they see it, so the fix is visibility, more impression share, through indexing, A+ content or ad placement. A share that falls off a cliff between impressions and clicks instead points at the listing itself, the main image, price, title or review count, not the budget. The same arithmetic works at any scale: divide the brand's count by the marketplace total for each stage and watch where the percentage drops the hardest.
A dash is not a zero
Per Amazon's own help page, The metric value of '-' means that the data is unavailable. This occurs when data has not been captured for the selected time period, or if the metric is new. Treating a dash as zero in a spreadsheet pull will understate real performance; filter those rows out of any share calculation instead of averaging them in.
Alongside the four raw counts, both the Brand and ASIN views also surface rate columns, click rate, cart-add rate and purchase rate, each one a stage's count expressed as a ratio rather than a total; Amazon's own Metric Glossary, linked from the same help page, is the only place that documents the exact formula behind each one, and sellers comparing their own hand-calculated percentage against the dashboard's rate column have found the two do not always match exactly, since the glossary's definition is not always the simple count divided by query volume it looks like at a glance. Treat the rate columns as Amazon's own calculation to read directly, not a number to reverse-engineer or recompute by hand from the counts next to it.
Common mistakes when reading this dashboard
Comparing it to an advertising report metric for metric: the two attribution models differ by Amazon's own admission, so a side-by-side reconciliation will never balance and is not meant to.
Averaging in rows marked with a dash: a dash means missing data, not zero, and folding it into an average silently drags every share calculation down.
Reading the Brand view when the real question is about one SKU: the Brand view's 1,000-query cap and catalog-wide aggregation hide single-product problems that only the ASIN view or Query Detail view surface.
Expecting weekly granularity on the Amazon's Choice badge or outliers downloads: both of those only run at the monthly reporting range, so a weekly pull simply will not offer them.
Treating backend search terms and Search Query Performance as the same keyword list: one is a seller-written field Amazon indexes, the other is a measured record of what customers actually searched and did.
The Query Detail view: seeing exactly who is beating you
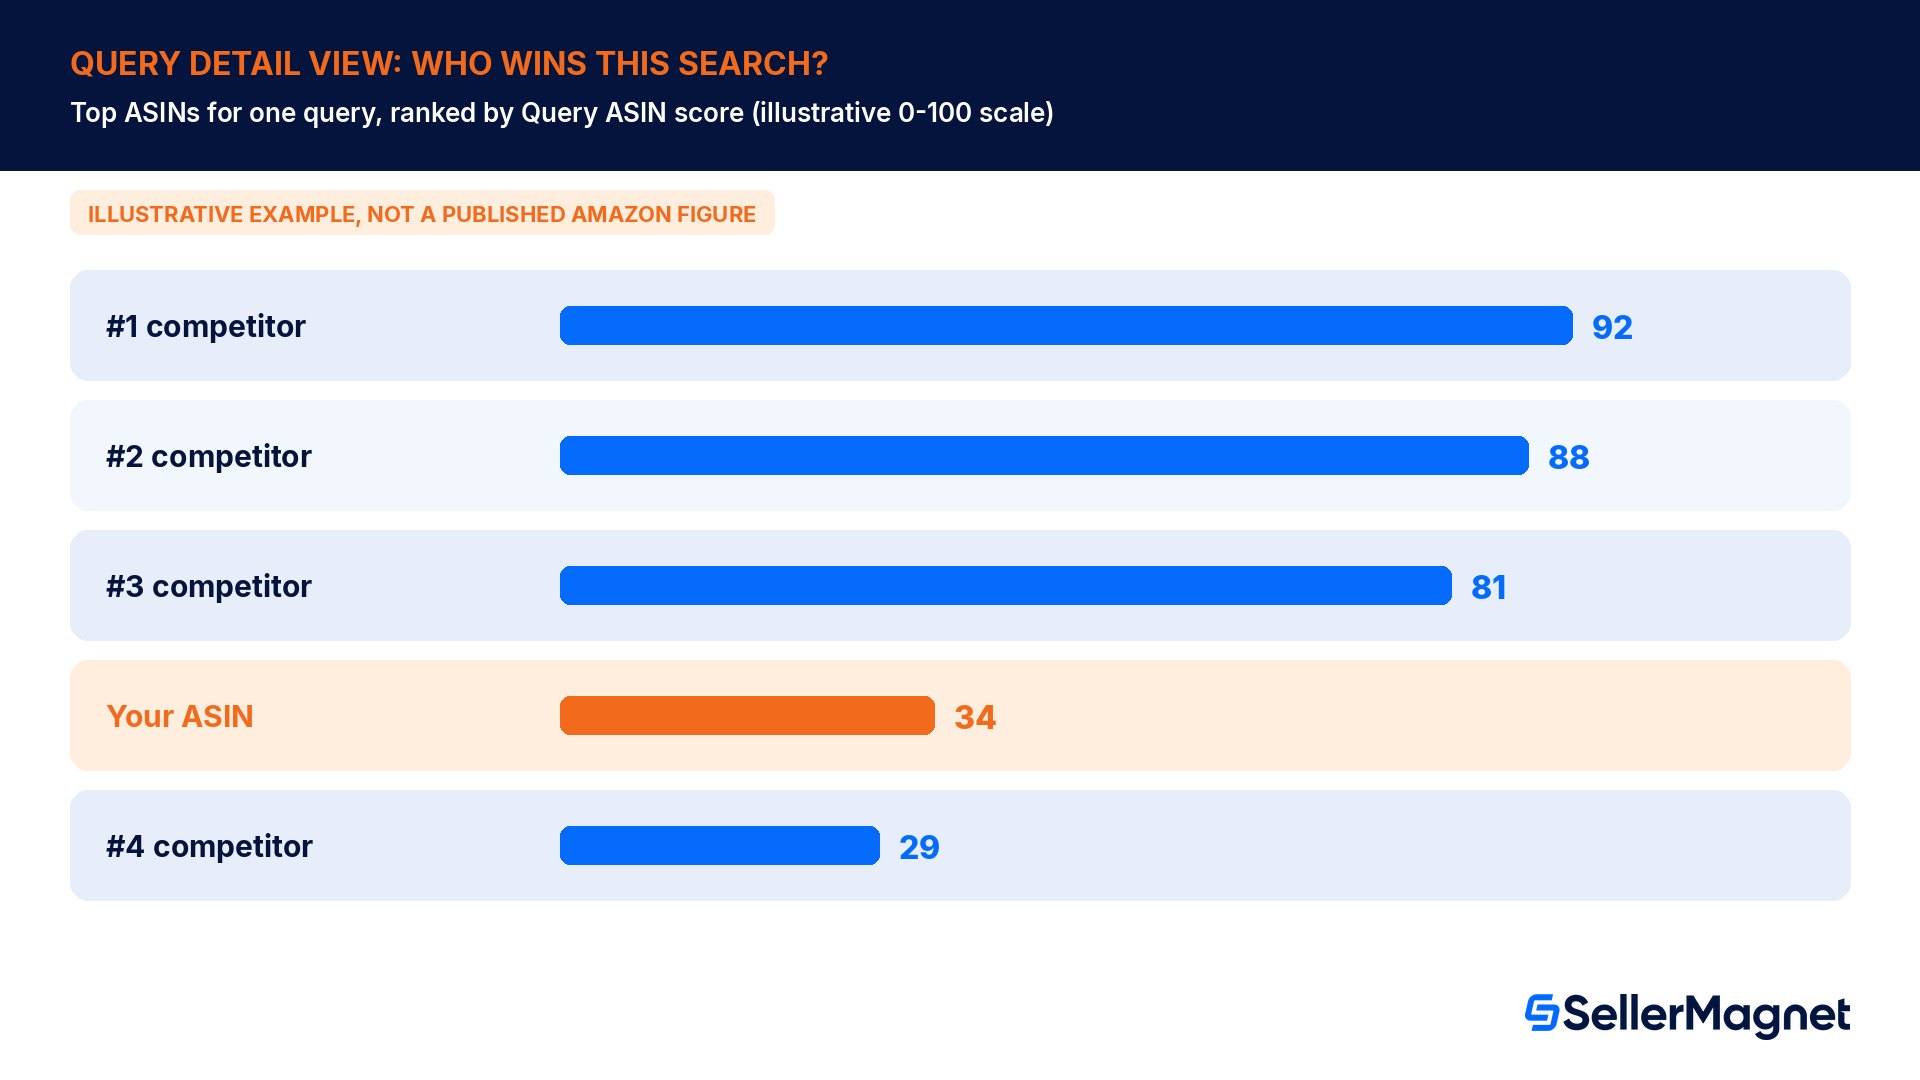
Amazon's help page describes the Query Detail view directly: The Query Detail view provides visibility into the performance of the top 10 ASINs for the selected search query from the Search Query Performance dashboard in comparison to your selected ASIN. The top performance is selected based on the Query ASIN score, calculated using a combination of search funnel impressions, clicks, cart adds, and buys. That single combined score is what ranks the list, not any one metric in isolation, so a competitor with slightly fewer impressions but a much higher cart-add and purchase rate can still outrank a product with more raw visibility. This view is where a brand sees, for one specific search term, not just that its own share is thin, but the exact set of competing ASINs splitting the rest of the demand, which is the starting point for deciding whether the fix is a listing change, a pricing move or a Sponsored Products placement on that term.
Search Query Performance vs. Search Catalog Performance: query-first or product-first
The two dashboards Amazon launched together in 2022 answer the same underlying question from opposite directions, and mixing them up wastes the whole exercise. Amazon's help page for the companion report states it plainly: the Search Catalog Performance dashboard tells brand representatives how the ASINs in their catalog are performing throughout the sales funnel, with an emphasis on search performance. Each row of that report represents the performance of an ASIN in the catalog, aggregated across ALL queries, for a selected time period. That is the mirror image of Search Query Performance's Brand view, where each row is one query aggregated across the whole catalog. Search Catalog Performance starts from the product and shows every query feeding it; Search Query Performance starts from the query and shows every product competing for it. A brand asking which of its SKUs is underperforming in search wants Search Catalog Performance; a brand asking which search term is its category's real growth opportunity wants Search Query Performance. Both share the same organic-plus-Sponsored-Products scope, the same widget exclusion, and the same dash-means-missing-data rule, because they are built from the same underlying search-funnel event data, just rolled up from a different starting point.
Search Query Performance
Search Catalog Performance
Row represents
One search query
One ASIN
Aggregated across
The whole catalog per query (Brand view) or one ASIN (ASIN view)
Every query that ASIN appeared in
Best starting question
Which queries am I losing share on
Which products are weak in search
The four download types, and the two that only run monthly
Both dashboards also share one export feature, added after launch and announced on the Seller Forums as Download your Brand Analytics Search dashboard data: Choose from four types of downloads. Amazon lists them by name: a Simple view (Download the report exactly how you see it on the previous page with your selected filters and columns), a Comprehensive view available for Search Query Performance only (Download the report for your selected brand and date range for all of your queries), Amazon's Choice badge data (Search funnel monthly query performance of your brand, with and without Amazon's Choice badge. This allows you to understand how Amazon's Choice badge impacts your catalog performance. This is only available at the monthly reporting range), and Search funnel outliers data (Search funnel metrics that include your top and bottom performing queries. This allows you to focus on specific search query performance without the need to review thousands of queries. This is only available at the monthly reporting range). The badge-comparison and outliers downloads both carry that same monthly-only restriction, so a brand testing whether winning Amazon's Choice on a query actually moved its funnel share, or trying to isolate its best and worst queries out of a catalog too large to scroll through, has to pull a monthly export to get either answer; neither download type exists at the weekly view. The path to any of the four is the same: open Brand Analytics, choose the dashboard, click Generate Download, pick the download type, click Generate Download again, then collect the file from the Download Manager.
Why these numbers will not match your other dashboards
Amazon's help page states this limitation without qualification: The metrics in the Search Query Performance dashboard do not replace metrics found in other Amazon reports, including advertising dashboards. The purpose of this dashboard is to highlight your brand and ASIN performance in search, so that all metrics are specific to search results. Since dashboards may attribute and define customer actions in different ways, we do not recommend comparing the metric names of data across different dashboards. In practice that means an impression count here and an impression count on a Sponsored Products campaign report are not the same measurement counted twice, they are two different definitions of impression, one scoped to search results pages only and one scoped to wherever that specific ad type can serve. Reconciling the two line by line is the wrong exercise; reading each for the question it actually answers is the right one.
The rest of the Brand Analytics suite
Amazon's own related-articles list on the Search Query Performance help page points to the rest of the suite worth knowing about alongside this one: the Amazon Search Terms report (the keyword-level report most sellers already check for PPC), Customer Loyalty Analytics, the Demographics dashboard, Market Basket Analysis and Repeat Purchase Behavior, on top of the Search Catalog Performance dashboard already covered above. None of those substitute for Search Query Performance; each answers a different question about the same customer base, and none require anything beyond the same Brand Representative role already needed to open this one.
Not the same as backend search terms
Search Query Performance measures what shoppers actually typed and did. It has nothing to do with the backend search terms field a seller fills in on a listing, which is a 250-byte keyword field Amazon's indexing reads, never shown to customers and never measured here, and it is not a replacement for the advertising-side search-term report used to decide when to negate a PPC keyword.
Turning the report into three actual moves
Keyword expansion for PPC: a query where the brand's impression share is already decent but click or purchase share lags is a candidate to defend with a Sponsored Products bid before a competitor's rising Query ASIN score turns into a permanent lead; cross-check it against the brand's own ACoS and TACoS targets before committing budget.
Listing and A+ content fixes: Amazon's own guidance ties this report directly to listing work, saying it lets a brand fine-tune its marketing strategies and enhance listings, including A+ content, by adding keywords that align with customer interests; a query with strong impression share but weak click share usually means the title, main image or price needs attention before an ad budget does.
Early demand signal: Amazon also states the dashboard can spot trends that may represent new product opportunities, so a rising total marketplace volume on a query the brand barely touches is worth treating as a sourcing or catalog-expansion signal, pairing it with Product Opportunity Explorer data rather than acting on the query count alone.
Defending a share that is already won: once a query's funnel share looks healthy, BSR and Buy Box rank alerts catch the moment a competitor starts eating into it, instead of only finding out at the next monthly Search Query Performance pull.
FAQ
Do I need to be Brand Registered to see Search Query Performance?
Yes. It sits inside Brand Analytics, which only opens to sellers with an active Brand Representative role on a brand in Brand Registry; a regular seller account without that role, or a brand with nobody holding the role yet, has no access to this report at all. A permissions error there is fixed in global user permissions, not support.
What is the difference between the Brand view and the ASIN view?
The Brand view aggregates each query against the whole brand catalog, capped at 1,000 queries; the ASIN view aggregates the same query data down to a single product, better for checking whether one specific listing is capturing the searches it should. Scan the Brand view first, then drop into the ASIN view for any product worth investigating further.
Does Search Query Performance include paid traffic, organic traffic, or both?
Both. Amazon's help page states the queries included come from organic results and Sponsored Products placements on the search results page, for all customers, while traffic from on-page widgets such as Top Rated or New Arrivals is excluded. That blended scope is exactly why its totals will always run higher than a Sponsored Products search-term report covering paid clicks alone.
Why does a cell show a dash instead of a number?
A dash means the data is unavailable for that period, either because it was not captured or because the metric is new, not that the real value is zero. Filter dash rows out before calculating any share, since treating a dash as zero in a spreadsheet pull will quietly understate a brand's real funnel performance for that query and period.
Can I compare Search Query Performance numbers to my advertising reports?
Amazon explicitly advises against it. The two report families attribute and define customer actions differently, so a metric with the same name in each is not measuring the exact same event. Read each report for the question it was built to answer instead of reconciling the two line by line; that reconciliation will never balance.
Can I export the Search Query Performance data?
Yes. Amazon added a direct download for both Search Query Performance and Search Catalog Performance, announced on the Seller Forums, so the full table can be pulled into a spreadsheet or another system. Four download types exist, Simple view, Comprehensive view, Amazon's Choice badge data and search funnel outliers data, reached through Generate Download and collected from the Download Manager.
What is the difference between Search Query Performance and Search Catalog Performance?
Search Query Performance starts from the search query and shows every product competing for it; Search Catalog Performance starts from the ASIN and shows its performance aggregated across every query it appeared in. They share the same organic-plus-Sponsored-Products scope and exclusions, so picking between them comes down to whether the question starts with a query or with a specific product.
Can I see how Amazon's Choice affects my search performance?
Yes, through the Amazon's Choice badge data download, one of four export types Amazon offers for Search Query Performance. It compares a brand's search funnel performance with and without the badge, but only at the monthly reporting range, not weekly, so a brand testing this has to wait for a full month.
Where SellerMagnet fits once you have read the report
Search Query Performance tells a brand which queries are worth fighting for and where in the funnel the fight is being lost. Turning that into action is a separate step: harvesting the exact search terms worth a Sponsored Products bid, then tracking what that bid actually returns, is what the PPC Manager keyword research and search-term tooling is built for, inside the trial caps on automation Amazon itself always keeps in force. When the fix is the listing rather than the bid, the Listing Optimizer checks title, bullet and backend-term quality against the keywords a query report says actually matter, rather than guessing which field to rewrite first. And because none of this means anything without knowing whether a query is also translating into real net profit after fees, shipping, VAT, refunds and COGS, the Analytics dashboard is where that per-order margin number lives, so a brand expanding into a high-volume query is not accidentally expanding into a loss. Read together, Search Query Performance says where the demand is and which share of it is slipping away; the three tools above are where a brand actually does something about it instead of bookmarking the dashboard and checking it again next quarter.
Stop Juggling Tools. SellerMagnet Combines Everything You Need.