ACoS vs TACoS: Formulas, Targets and Which One to Run Your Business On
R
RenéFreelance Amazon Editor
|
13 min read
Last updated: Oct 15, 2026
ACoS and TACoS both put a percentage on how hard your Amazon ads are working, and sellers mix them up constantly because the inputs look similar and the outputs move in the same direction most of the time. ACoS (Advertising Cost of Sale) divides ad spend by ad sales only, so it tells you whether a single campaign pays for itself. TACoS (Total Advertising Cost of Sale) divides the same ad spend by total sales, organic plus paid, so it tells you how dependent your whole business is on ads. This page gives the exact formula for each, a worked example that reconciles to the cent, the break-even ACoS calculation that should set your real target instead of a round number copied from a forum post, and which metric to run your business on at each stage of a product's life.
ACoS is ad spend divided by ad sales, showing whether a single campaign is profitable on its own. TACoS is ad spend divided by total sales (organic plus ad), showing how reliant the whole listing is on advertising. A healthy pattern is ACoS holding steady or improving while TACoS falls over time, because that means ads are building organic rank rather than just buying the same sales over and over.
What is ACoS and how do you calculate it?
ACoS answers one question: for every dollar spent on ads, how many cents came back as ad-attributed revenue. It only looks at the campaign side of the ledger, which is why it is the number shown inside Amazon's own Advertising Console next to each campaign, ad group and keyword. For the profit side of that same ledger, Profit Analytics shows net profit per order after Amazon fees, COGS, shipping, VAT, refunds and ad spend, so ACoS and real margin sit in one place instead of two spreadsheets.
Term
Formula
Worked example (one campaign)
Ad spend
Sum of clicks x CPC for the period
$420 spent in the week
Ad sales
Revenue from orders Amazon attributes to that ad
$1,750 in attributed sales
ACoS
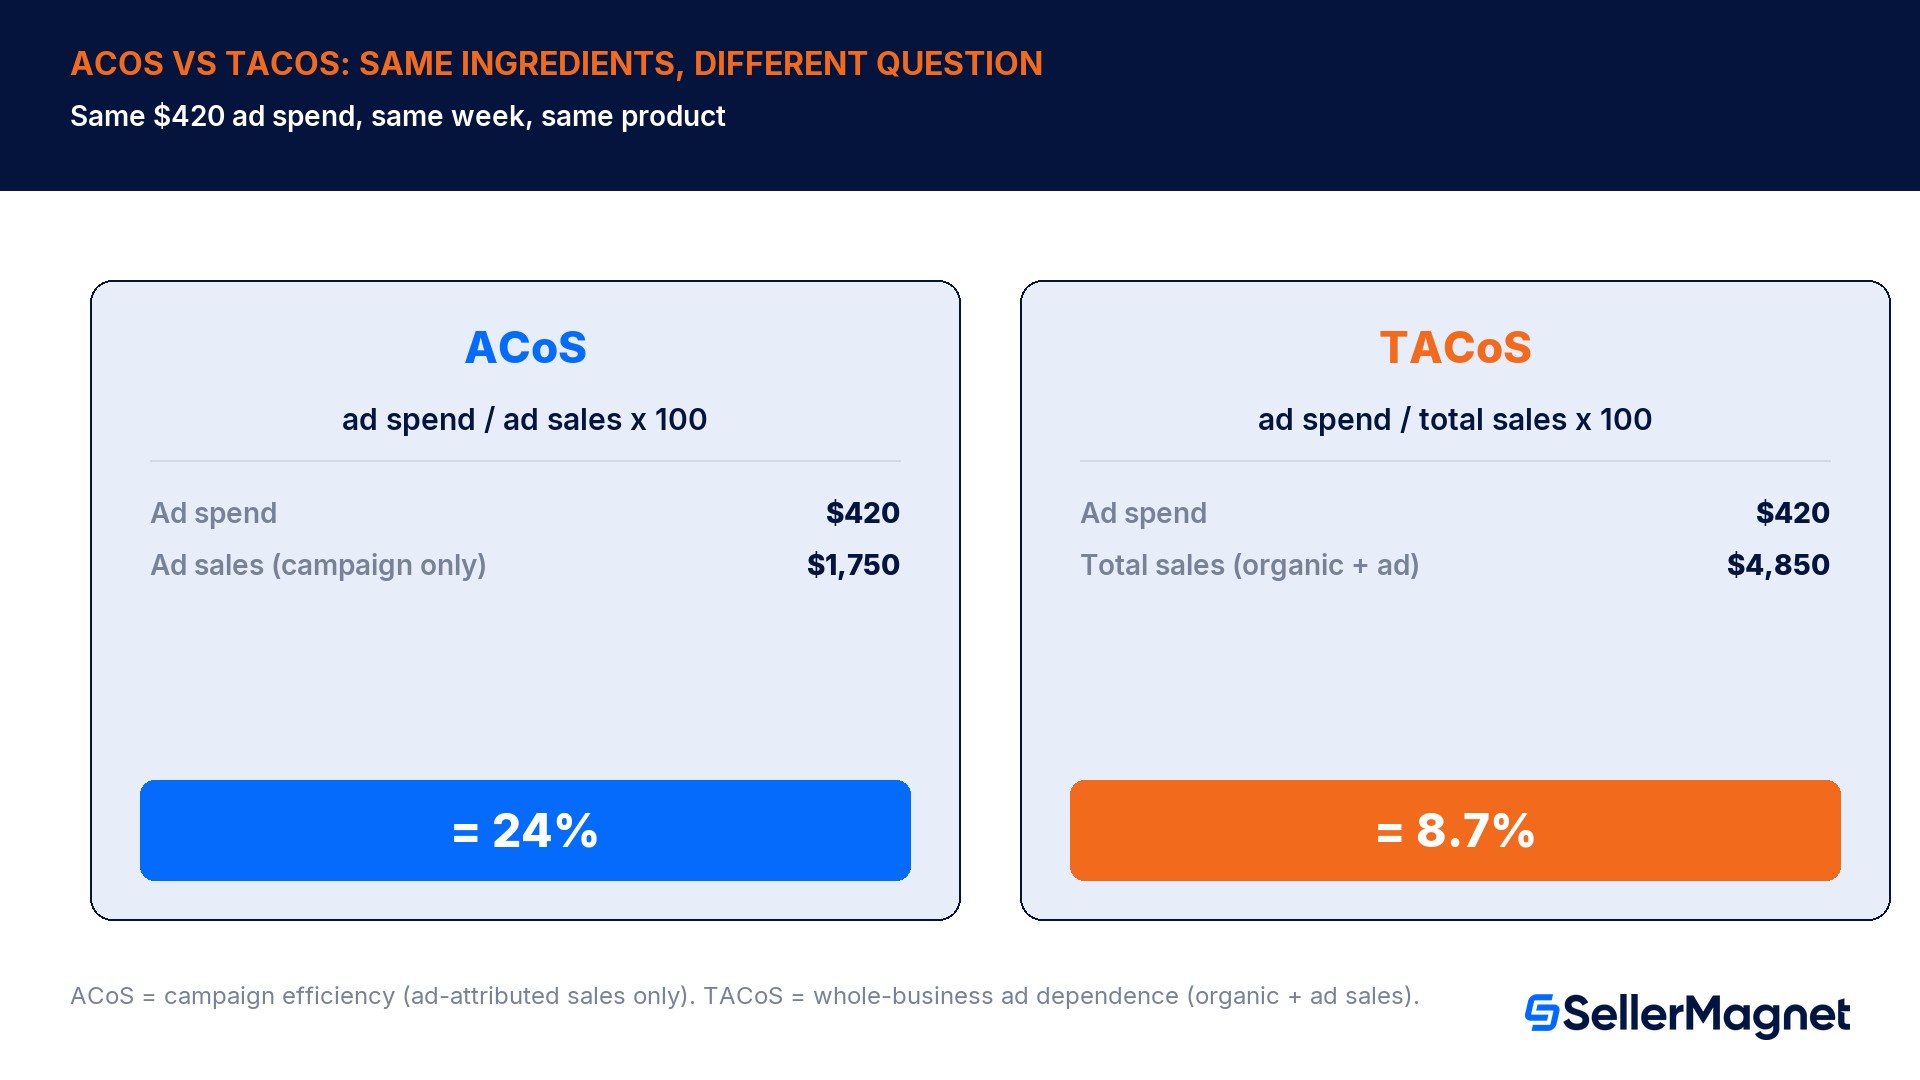
ad spend / ad sales x 100
$420 / $1,750 x 100 = 24%
ROAS (the inverse)
ad sales / ad spend
$1,750 / $420 = 4.17
A 24% ACoS means 24 cents of every ad-attributed sales dollar went to Amazon Ads, leaving 76 cents to cover the product's cost, Amazon's own fees, and whatever profit is left. ACoS says nothing about sales that happened without an ad click, so two listings with identical 24% ACoS can have completely different real profitability once their organic sales volume is added back in.
Lower ACoS is not automatically better
A campaign chasing branded, already-converting search terms can post an artificially low ACoS by capturing clicks that would have converted organically for free, which looks efficient on the report and wastes ad budget in practice. Check what the campaign's keywords actually are before reading a low ACoS as a win.
What is TACoS and how is it different?
TACoS swaps the denominator: instead of ad sales only, it divides the same ad spend by total sales, organic and advertised combined, for the same ASIN or account over the same period. Amazon's own Advertising Console does not calculate TACoS for you (it only reports ad sales), so it has to be computed from your orders report and your ads report together.
Term
Formula
Same week, same product
Total sales
Organic revenue + ad-attributed revenue
$3,100 organic + $1,750 ad = $4,850 total
TACoS
ad spend / total sales x 100
$420 / $4,850 x 100 = 8.7%
Ad sales share of total
ad sales / total sales x 100
$1,750 / $4,850 x 100 = 36.1%
Same $420 of ad spend, same week, same product: a 24% ACoS and an 8.7% TACoS are two true numbers describing two different things. ACoS says the campaign itself is moderately expensive relative to what it directly sold; TACoS says ads only account for a little under 9 cents of every total sales dollar the product brought in, because organic sales ($3,100) are carrying most of the volume. Reading either number alone, in isolation, hides the other half of the picture.
ACoS is a campaign-level efficiency number: it moves with bids, keywords and placements, and it exists the moment a campaign runs. TACoS is an account or ASIN-level health number: it only becomes meaningful across weeks or months, because a single day of organic sales is noisy. Neither one is the business's profit margin; both describe how advertising spend relates to revenue, not how much of that revenue is actually profit.
Break-even ACoS: the real target, not a guess
The most common ACoS mistake is picking a target from a forum thread ("aim for under 15%") instead of computing the number where the product itself stops being profitable on an ad-attributed sale. Break-even ACoS is the formula SellerMagnet's own PPC Manager uses to flag unprofitable bids: break-even ACoS equals (price minus every cost except ads) divided by price, expressed as a percentage. Every cost line that is not ad spend, referral fee, FBA fulfillment fee, storage, landed cost, goes into that subtraction once.
Line item
Amount
Running total
Sale price
$24.99
$24.99
Referral fee (15%)
-$3.75
$21.24
FBA fulfillment fee
-$4.80
$16.44
Monthly storage allocation
-$0.35
$16.09
Landed cost (product + freight + prep)
-$7.50
$8.59
Margin before ads
$8.59
Break-even ACoS
$8.59 / $24.99 x 100
34.4%
Check it forward: $24.99 minus $3.75 minus $4.80 minus $0.35 minus $7.50 is exactly $8.59, and $8.59 divided by $24.99 is 34.4%. That means this specific product can run ad campaigns up to a 34.4% ACoS and still break even on the ad-attributed sale before ads; above 34.4%, every additional ad-attributed sale loses money on its own, even though the campaign might still be worth running to protect rank or launch a new ASIN. A lower-margin product with the same $24.99 price but a $12 landed cost instead of $7.50 would have a margin of $24.99 - $3.75 - $4.80 - $0.35 - $12.00 = $4.09, giving a break-even ACoS of $4.09 / $24.99 x 100 = 16.4%, a completely different number from the exact same price point.
Compute break-even ACoS per ASIN, not per account. The free SellerMagnet Fee Calculator pulls Amazon's public fee schedule to show referral and fulfillment fees per ASIN with 5 free lookups a day. Inside PPC Manager (currently in beta), the Scenario Simulator forecasts a target-ACoS, budget or bid change against your real last-30-day data before you touch a live campaign, and the AI Optimizer flags bids sitting above a product's own break-even line, starting in suggestions-only mode so nothing changes on Amazon until you approve it.
How do you calculate TACoS when Amazon does not show it to you?
Amazon's Advertising Console reports ad spend and ad sales per campaign, but it has no total-sales column, so TACoS cannot be read off a single screen. It has to be assembled from two separate reports for the same product and the same date range.
Build a TACoS number from Seller Central
Pull total sales - In Business Reports, filter by ASIN or parent ASIN for the period and record the total ordered product sales figure, which already includes both organic and ad-attributed units.
Pull ad spend and ad sales - In the Advertising Console, filter campaigns to the same ASIN over the same date range and record total spend and total ad sales; a product advertised across Sponsored Products, Sponsored Brands and Sponsored Display needs all three added together.
Divide ad spend by total sales - TACoS = ad spend / total sales x 100. Use the same currency and the same date range for both numbers or the result is meaningless.
Log it alongside ACoS - Keep both numbers side by side in the same tracker; a TACoS number with no matching ACoS hides whether a change in TACoS came from the campaign or from organic sales moving on their own.
Running the two reports separately and reconciling them by hand is the main reason TACoS gets tracked monthly rather than daily on most accounts; daily organic sales are noisy enough that a day-to-day TACoS swings on random variation that has nothing to do with the ad account.
What is the difference between ACoS, TACoS and ROAS?
All three numbers come from the same three raw inputs, ad spend, ad sales and total sales, just divided differently. Seeing them on one row for the same product and period makes it obvious that none of the three is wrong; they each answer a different question.
Metric
Formula
Question it answers
Same product, same week
ACoS
ad spend / ad sales x 100
Is this campaign paying for itself on its own sales?
24%
ROAS
ad sales / ad spend
How many sales dollars per ad dollar, read the other way round?
4.17
TACoS
ad spend / total sales x 100
How reliant is the whole product on ads right now?
8.7%
Ad sales share of total
ad sales / total sales x 100
What fraction of all sales needed an ad click?
36.1%
A seller who only ever looks at ACoS can run a perfectly profitable-looking campaign on a product whose organic sales are quietly declining, because ACoS has no way to show that. A seller who only ever looks at TACoS can miss that a specific campaign inside the account is bleeding money well above its own break-even line, because TACoS blends every campaign on that ASIN into one number. Reviewing both, on a schedule, closes both blind spots.
ACoS vs TACoS over time: what the trend actually tells you
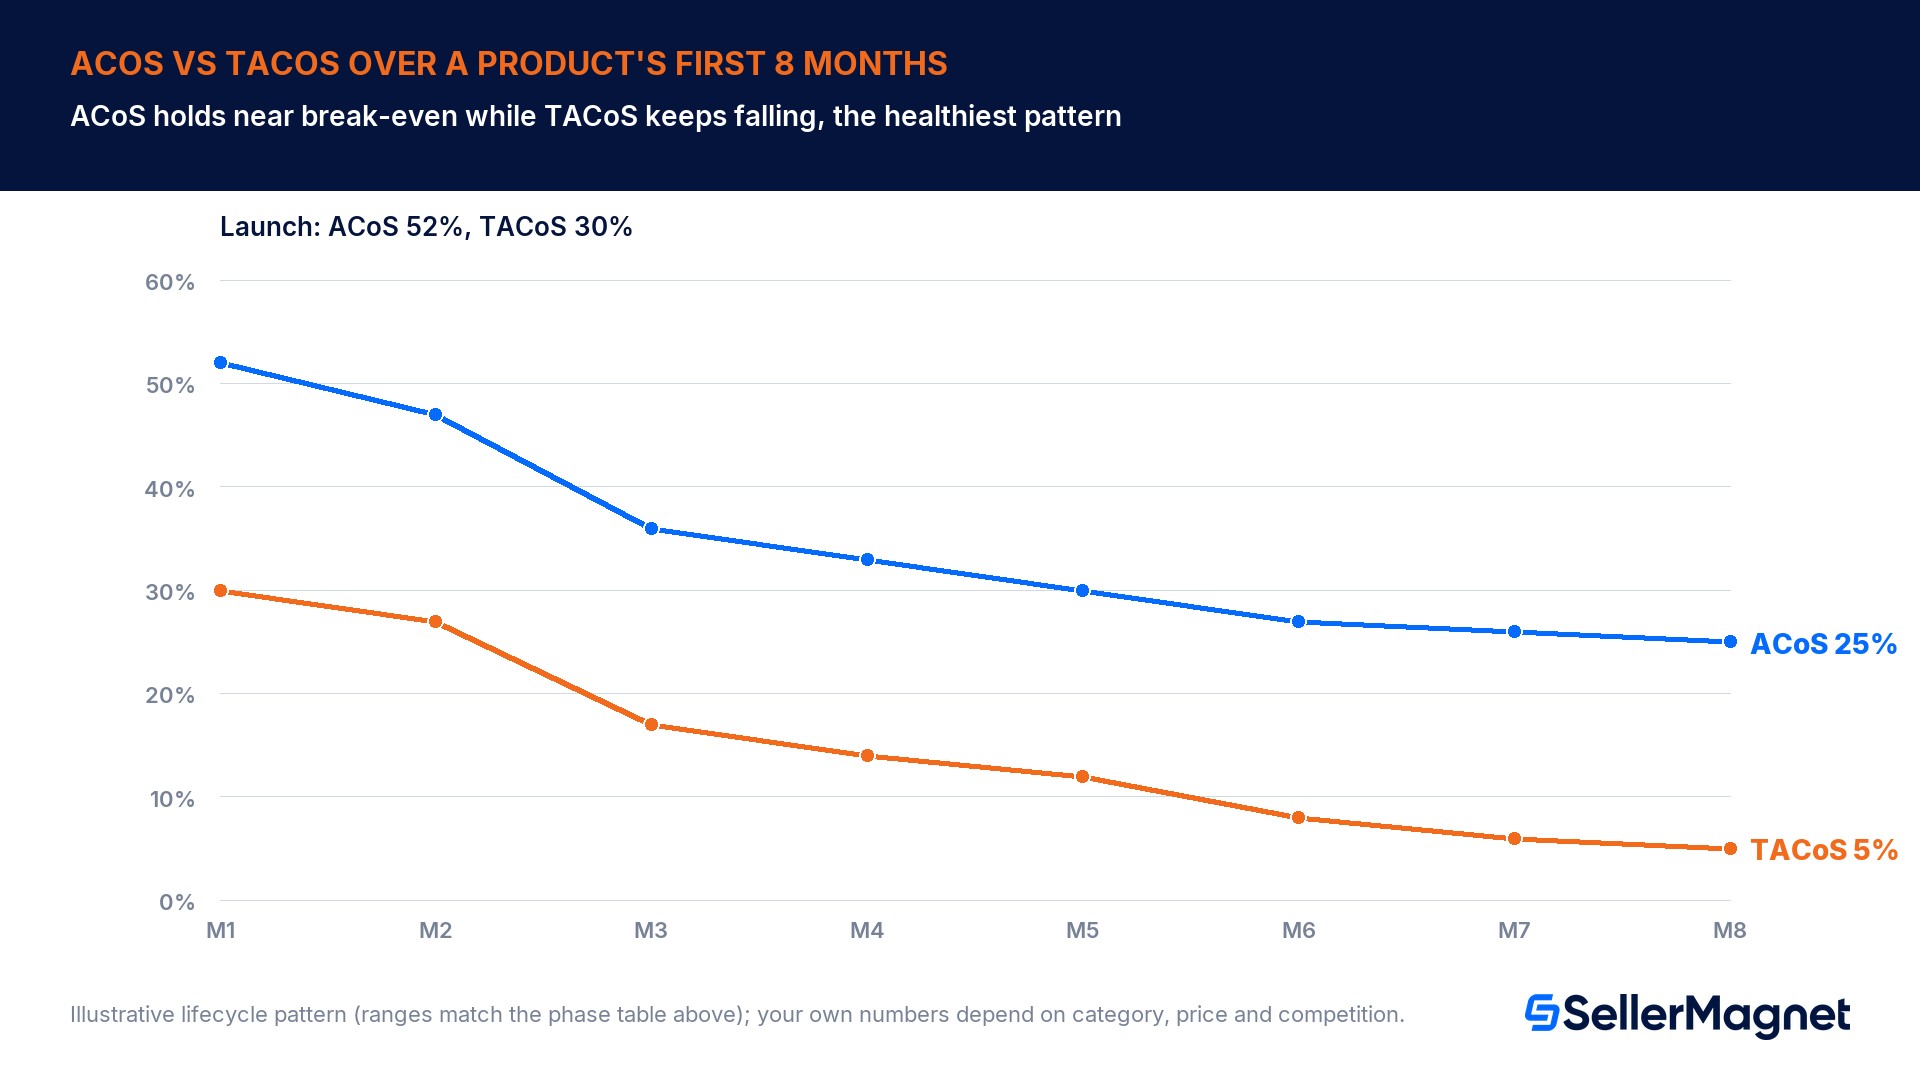
A single week's ACoS or TACoS is a snapshot; the pattern across months is what actually tells a seller whether advertising is building the business or just renting the same sales every week. The chart below follows one product through three phases of a typical PPC lifecycle: an aggressive launch, a stabilizing middle, and a mature phase where organic rank has taken over most of the volume.
Phase
ACoS trend
TACoS trend
What is actually happening
Launch (month 1-2)
High, 40-55%
High, 25-35%
Little to no organic rank yet; almost every sale needs an ad click to happen at all
Stabilizing (month 3-5)
Falling, 30-38%
Falling, 12-18%
Organic rank is climbing from the sales history ads generated; the same spend reaches a bigger total
Mature (month 6+)
Flat, around break-even
Low and still falling, 4-8%
Organic sales now carry most of the volume; ads mainly defend the top slot and launch variations
The signal to watch for is TACoS falling while ACoS holds roughly steady or even rises slightly: that combination means the ad spend itself did not get cheaper, but it is buying more total business than it used to, because organic sales are compounding on top of it. The opposite pattern, a falling ACoS with a flat or rising TACoS, deserves a closer look: it can mean the campaigns genuinely got more efficient, but it can also mean organic sales slipped and the same ad spend is now propping up a total that used to come partly for free.
Common mistakes with ACoS and TACoS targets
Copying a target ACoS from another seller's product. Break-even ACoS depends on that specific product's price, referral fee category and landed cost; a 20% target that is safe for one ASIN can already be a loss on another.
Reading ACoS alone during a launch. A 50% ACoS in the first two weeks of a new ASIN is often by design, to generate the sales velocity that organic rank is built from; judging it against a mature-phase target compares two different situations.
Averaging TACoS across a whole catalogue. A catalogue average can hide a handful of ASINs quietly running at 25%+ TACoS for months while the account-wide number looks healthy; compute it per ASIN or per parent product.
Treating a falling ACoS as proof a campaign improved. Falling ad sales from falling impressions produce the same falling ACoS as rising ad sales from better targeting; check the ad sales number moved in the direction you think it did.
Setting a target ACoS once and never recalculating it. Referral fee tiers, FBA fulfillment fees and landed costs all change through the year (peak season storage and fulfillment rates, freight cost swings), so a break-even ACoS computed in January can be stale by October.
Ignoring ROAS when comparing platforms or reports. Some reporting tools default to ROAS (ad sales / ad spend) instead of ACoS (ad spend / ad sales); a 4.0 ROAS and a 25% ACoS describe the same campaign, but reading one as the other produces a number 4x or 0.25x off.
Track ACoS weekly per campaign to catch bid or keyword problems early.
Track TACoS monthly per ASIN or parent product, not per account average, to see real ad dependence.
Expect ACoS to run above break-even during a deliberate launch phase; set a review date to bring it back down.
Watch for TACoS falling while ACoS holds steady: that is the pattern that means ads are compounding into organic rank.
Recalculate break-even ACoS whenever referral fee category, fulfillment fee tier, or landed cost changes, and again before and after peak season rate changes.
Confirm whether a report is showing ACoS or ROAS before comparing two tools' numbers side by side.
What is a good ACoS for Amazon PPC?
There is no universal good ACoS; the only number that matters is the product's own break-even ACoS, computed as (price minus every non-ad cost) divided by price. A launch campaign often runs well above that line on purpose to build sales velocity, while a mature, stable campaign should sit at or below its break-even line, reviewed on a set schedule.
What is a good TACoS for an Amazon product?
Mature, organically ranked products often settle between 4% and 10% TACoS once ad spend mostly reinforces rank rather than generating it, while a product in its first few months can run 20% to 35% while it builds organic sales history from close to zero. The direction, falling over time, matters more than hitting one fixed number straight away.
Is a lower ACoS always better?
No. An ACoS pushed artificially low by targeting branded or already-converting search terms can mean the campaign is capturing sales that would have happened organically for free, which wastes ad budget even though the report looks efficient. Check which keywords actually drove the number, and whether those clicks were incremental, before reading a low ACoS as a genuine win.
How do I calculate break-even ACoS?
Subtract every cost except ad spend, the referral fee, the FBA fulfillment fee, a storage allocation and your landed cost, from the sale price, then divide the remaining margin by the sale price and multiply by 100. That is the highest ACoS at which an ad-attributed sale still breaks even, and it should be recalculated whenever a cost line changes.
Does Amazon show TACoS in Seller Central?
No, the Advertising Console only reports ACoS and ROAS per campaign because it only sees ad-attributed sales, never a product's full organic revenue. TACoS has to be computed separately, by combining total sales from your Business Reports with ad spend from your advertising reports for the same ASIN and date range, then dividing by hand.
What is the difference between ACoS and ROAS?
They are mathematical inverses built from the same two numbers: ACoS is ad spend divided by ad sales, ROAS is ad sales divided by ad spend. A 25% ACoS and a 4.0 ROAS describe the exact same campaign and the same underlying performance; neither reading is more accurate, they just express the relationship in opposite directions for different tools.
Should a new Amazon listing target ACoS or TACoS first?
ACoS first. A brand-new listing has little to no organic sales history to put into a TACoS calculation, so ACoS measured against a deliberately higher launch-phase target is the more useful day-to-day number, right up until organic rank and sales history build up enough over several weeks to make a monthly TACoS reading meaningful rather than noisy.
Stop Juggling Tools. SellerMagnet Combines Everything You Need.